




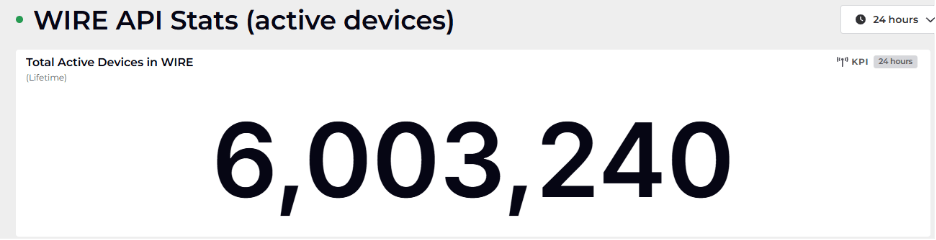
Recast has hit over six million devices processed by its Warranty Services. While analyzing those results, I started developing a Device Lifecycle Score to better understand device age, lifecycle health, and refresh planning across real-world endpoint environments.
As someone who spends a lot of time looking at endpoint data, I couldn’t resist digging into the results. The data set includes devices from organizations of all sizes, industries, and environments. It is one of the more interesting collections of hardware lifecycle data I have had the opportunity to review.
One of the first things that stood out was the variety of hardware manufacturers. After normalizing manufacturer names to remove obvious duplicates, spelling variations, and inconsistent naming formats, there are still more than 500 distinct manufacturers represented in the list.
That said, the market concentration is also very clear. The top three manufacturers account for approximately 78% of all devices processed through the service. In other words, while the endpoint ecosystem includes a large number of vendors, most organizations are still heavily standardized around a small group of manufacturers.
This analysis led me to a simple question: Could we create a practical, easy-to-understand score that helps IT teams evaluate device age and lifecycle risk?
That question became the foundation for Device Lifecycle Score.
What is Device Lifecycle Score?
Device Lifecycle Score is a simple way to represent the lifecycle condition of a device using a clear numerical value. The goal isn’t to replace detailed inventory, warranty, or asset management reporting. Instead, the goal is to give IT teams a quick way to understand whether a device is likely to be modern, aging, or potentially overdue for replacement.
Think of it as a starting point.
Most IT teams already have access to a lot of device data. They may know the model, serial number, warranty status, operating system, assigned user, installed software, and last check-in date. However, that information often lives in different reports, tools, dashboards, or spreadsheets.
Device Lifecycle Score attempts to simplify one important part of that story: device age.
A single score will never tell the whole story, but it can help identify where to look first.
Defining active devices
For this analysis, I considered active devices to be devices that have checked their warranty information within the last year.
That definition matters because not every device in a warranty data set is necessarily in daily use. Some devices may be in storage, assigned to lab environments, used occasionally, or no longer actively managed. By focusing on devices that checked warranty information within the last year, the analysis is better aligned with devices that are still relevant to an organization’s current endpoint estate.
That also makes some of the older results more interesting.
The oldest active device in the data set had a manufacturing start date of August 14, 2002. As I wrote this, the newest manufacturing date was just a few days earlier on the calendar, which made it stand out even more. It also made me think about how quickly a manufacturer can get a device into a client’s hands, and how quickly it can show up in our system.
Seeing a device that old still appear in the data is a reminder that hardware can have a much longer life than we often expect. It doesn’t mean the device is necessarily someone’s primary workstation, but it does show why lifecycle visibility matters.
Why device age matters
Device age is one of the most practical lifecycle indicators available to IT teams.
Older devices are more likely to have limitations around performance, warranty coverage, driver support, operating system compatibility, and user experience. They may still work, but they can become harder to support over time.
That doesn’t mean every old device must be replaced immediately. Some devices have low-impact roles. Others may be dedicated to a specific purpose. Some may still perform well enough for the work they are expected to do.
However, without a simple way to identify and compare device age across an environment, refresh planning can become reactive.
IT teams may end up replacing devices only after users complain, hardware fails, or compatibility issues appear. Device Lifecycle Score is intended to help shift that conversation toward proactive planning.
How Device Lifecycle Score is calculated
The current Device Lifecycle Score calculation is based on the age of the device.
The rough formula is:
10 – ((Today – Manufactured Date) – 1000 days) / 365.0 = Device Lifecycle Score
The idea is based on a few simple assumptions:
- A new or relatively modern device should score high.
- 1,000 days is approximately 2.75 years.
- Devices around that age are still generally considered healthy from a lifecycle perspective.
- As the device gets older, the score gradually decreases.
- The score gives IT teams a simple way to compare device lifecycle status across the fleet.
Using this model, the average Device Lifecycle Score for active devices across Recast customer environments where we have data is 9.41.
That result is encouraging. It suggests that many organizations are doing a reasonable job of maintaining modern devices, at least when looking at active devices in aggregate.
Of course, averages only tell part of the story.
An average Device Lifecycle Score of 9.41 doesn’t mean every device is in great shape. It means that, across the data set, many devices are still relatively modern. There can still be pockets of older hardware within specific departments, regions, business units, device types, or use cases.
That is where the score becomes useful. It gives teams a way to identify outliers and prioritize investigation.
Should warranty coverage affect Device Lifecycle Score?
As I reviewed the data, I kept coming back to one question: Should warranty coverage be part of the Device Lifecycle Score?
Age is important, but it isn’t the only lifecycle factor that matters.
For example, consider two devices that were manufactured four years ago.
One was purchased with a standard one-year warranty that expired years ago. The other was purchased with a five-year warranty and is still covered.
Should those two devices receive the same score?
I’m not sure they should.
That led me to experiment with an adjusted formula that accounts for warranty status:
(9 – ((Today – Manufactured Date) – 1000 days) / 365) + (if Warranty End Date > Today then 1.0 else 0.0)
With this approach, a device that is still under warranty receives an additional point. That means if an organization purchased a four-year or five-year warranty, the device could still have a Device Lifecycle Score of 10.0 even though it’s older than the original 2.75-year baseline.
I like this idea because it recognizes that lifecycle planning is not only about age. It’ also about supportability.
A four-year-old device that’s still under warranty is in a different support position than a four-year-old device that’s no longer covered. Warranty status gives IT teams more context about replacement urgency, support risk, and budget planning.
At the same time, I’m still thinking about whether warranty coverage should add a full point or whether it should be weighed differently. There may also be other factors that deserve to be included before finalizing the score.
Using Device Lifecycle Score for refresh planning
The real value of Device Lifecycle Score is not the score itself. The real value is what IT teams can do with it.
A well-designed Device Lifecycle Score could help organizations:
- Identify devices that should be reviewed for replacement.
- Prioritize refresh planning based on age and lifecycle risk.
- Compare device health across departments or business units.
- Support budget conversations with clearer data.
- Measure improvement over time.
- Reduce the number of surprise hardware issues.
- Align warranty strategy with refresh strategy.
This is where endpoint visibility becomes incredibly important.
For organizations using Recast solutions, lifecycle insights become more useful when paired with broader endpoint data. Tools such as Right-Click Tools Insights can help IT teams better understand their environment, identify patterns, and take action based on real endpoint information.
Device Lifecycle Score fits naturally into that type of operational workflow. It gives teams another way to turn data into decisions.
What the manufacturer data tells us
The manufacturer data was also worth reviewing.
More than 500 distinct manufacturers appeared in the normalized data set, but the top three accounted for approximately 78% of all devices. That tells me a few things.
First, standardization is still common. Many organizations prefer to work with a small number of hardware vendors because it simplifies purchasing, support, imaging, driver management, accessories, warranty handling, and lifecycle planning.
Second, there is still a long tail of device diversity. Even if most devices come from a few major manufacturers, IT teams still need to deal with exceptions. Specialty devices, inherited hardware, lab systems, kiosk devices, rugged devices, and regional purchasing differences can all add complexity.
Third, clean data matters. Manufacturer normalization may sound boring, but it’s essential. If the same manufacturer appears under several slightly different names, reporting becomes less accurate. Normalization helps ensure that analysis reflects reality instead of formatting inconsistencies.
This is one of those areas where small data-cleanup efforts can make reporting much more useful. Right Click Tools Insights normalizes manufacturer names for you. It’s common to see mismatched company names.
Questions for the Community
Device Lifecycle Score is still something I’m thinking through, and I would love feedback from others in the endpoint management community.
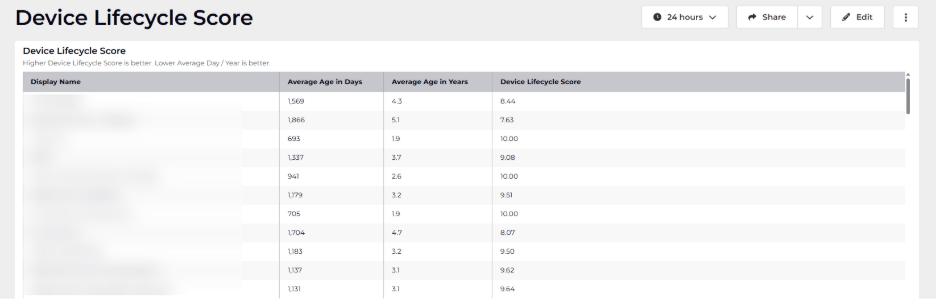
Above is the first (internal) generation of this report. I need to refine it so that it can be added to RMS, Power BI, and SSRS.
A few questions I’m considering:
- What do you want in a Device Lifecycle Score report set? How should the score look for the whole company? What about for each device?
- Would you use a Device Lifecycle Score to help prioritize device replacements?
- Should warranty coverage influence the score?
- If warranty coverage is included, how much weight should it have?
- Is 1,000 days, or roughly 2.75 years, a reasonable baseline?
- Should different device types have different scoring models?
- Should the score focus only on lifecycle age, or should it include other health signals?
- Would a simple score help with leadership conversations around refresh budgets?
I am especially interested in how organizations would use a score like this in practice.
Would it help with planning? Would it help justify budget? Would it help identify neglected hardware? Or would you need more context before trusting it?
Final thoughts
Analyzing more than six million devices processed through Recast Warranty Services has been fascinating. The data shows both the diversity and concentration of enterprise hardware, with more than 500 distinct manufacturers represented and the top three manufacturers accounting for approximately 78% of all devices.
It also reinforced the need for simple, practical ways to evaluate device lifecycle health.
Device Lifecycle Score is my attempt to start that conversation.
The current version is based on device age, with a rough calculation that uses 1,000 days as the baseline. Across active devices where Recast has data, the average Device Lifecycle Score is 9.41. That’s a strong result, but there is still more to explore.
Warranty coverage may play a role in the score. Device type may matter. Usage patterns may matter. DEX, security, and performance may eventually become part of a broader scoring model.
For now, Device Lifecycle Score provides a simple starting point for understanding device age and supporting better refresh planning.
I would love to hear your thoughts. Would you use a Device Lifecycle Score to help prioritize device replacement? Should warranty coverage be included? What else should be added to the score?
If you have ideas, questions, or feedback about this blog, please reach out to me. You can also catch me at MMS Midway this fall. I would be happy to talk about Device Lifecycle Score, warranty data, endpoint lifecycle management, or how your organization thinks about device refresh planning. Alternatively, you can post your feedback to our Ideas Portal or catch me in just about any of the ConfigMgr/Intune forums, social platforms, or email.