Reporting improvements have been one of the most requested features from the community of Application Workspace, a cross‑platform application layer that ties delivery and baselines to identity on Windows and macOS. Whether you’re tracking license usage, deployment success rates, or app launch health, better visibility helps you make better decisions.
What’s new in the latest release
With the latest Application Workspace release, you now have more data to work with, so you can build reporting that fits your environment. To help you get started, we built a Power BI template that simplifies setup and helps you build dashboards faster.
A quick note about the template
Quick note: I’m not a Power BI expert. Our template serves as a starting point. It includes the data points we expose today, plus examples of how to combine them into dashboards. It is not designed to be a finalized solution, but rather a beginning. As we add more data points in future releases, we’ll also update the template so your dashboards can grow with it.
How reporting data is collected
The template pulls reporting data through an OData feed (API endpoints). That feed pulls data directly from your Application Workspace zone. That means you’re not locked into Power BI. Any tool that can query OData can retrieve the data and report on it. We chose Power BI because it makes it easier to flatten nested data into report-ready tables. Some endpoints return nested fields (data inside data), which can be harder to work with in other tools. Power BI makes it easy to expand those additional data points into a consumable fashion. I tested Tableau and Grafana too. With my skill level, Power BI was the simplest path. We also have a Postman Collection you can use to explore every endpoint. It’s a great place to see how to make the API calls if you want a single data point, whereas Power BI brings all of the data points into one system.
Installing the right Power BI Desktop version
Before you open the template, install the right version of Power BI Desktop. You’ll see a few options for Power BI, including the downloadable desktop versions, the Microsoft Store versions, and the web version of Power BI in a browser. For this project, we built and tested the template using Power BI Desktop (optimized for Power BI Report Server).
Why the Report Server Optimized Version matters
We chose that version because it supports publishing to Power BI Report Server, and it keeps you compatible with all the potential on-prem reporting needs. First, it lets you publish your dashboard into a self-hosted Power BI Report Server, while also offering the ability to publish to the Power BI Online Reporting Service. Standard Power BI Desktop only publishes to the Power BI service and isn’t the version you use to publish to Power BI Report Server. You’ll also need Power BI Desktop to be able to use a template file (.pbit). While you can use either desktop version, we recommend Power BI Reporting Server as it’s the version designed for the most flexibility.
Download the Power BI template
Now that we have talked about how we created the template, let’s get into the template itself. You can download the template here. Navigate to Integrations. Locate Power BI Reporting Template, then select Download.
Create API credentials for the OData feed
Before you open the template, you need API credentials for the OData feed. You will see that it requires authentication to access your OData feed. This is also unique to each zone. You need to go and create a set of credentials for use with the dashboard. These aren’t your normal user credentials, so you won’t use your everyday username and password. You’ll create a client secret and pair it with the zone username. Right now, the username is your zone GUID. You just need to create the client secret. Full documentation is here: API Access Documentation. We’ll also walk through the steps below.
Generating a client secret
-
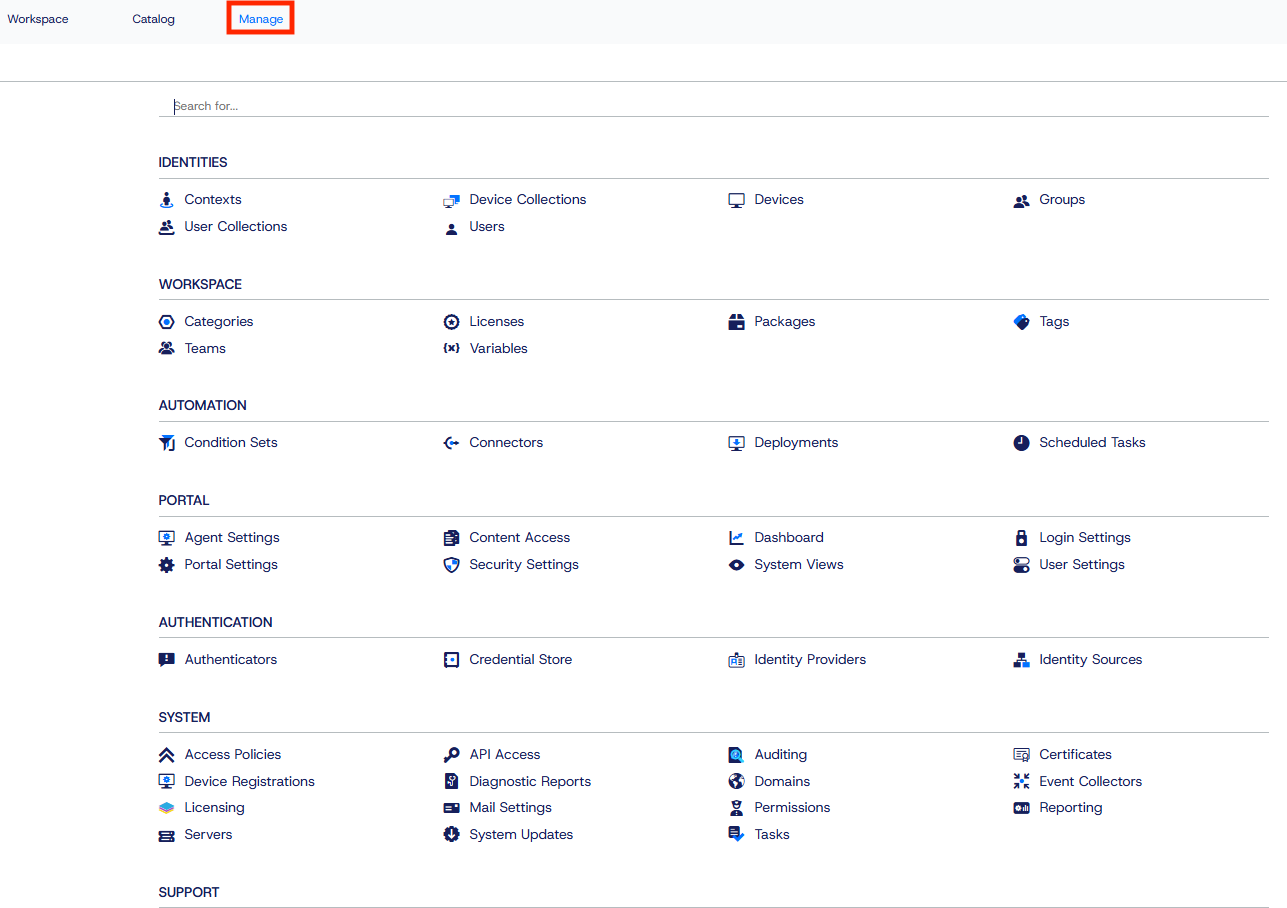
- Navigate to Manage.
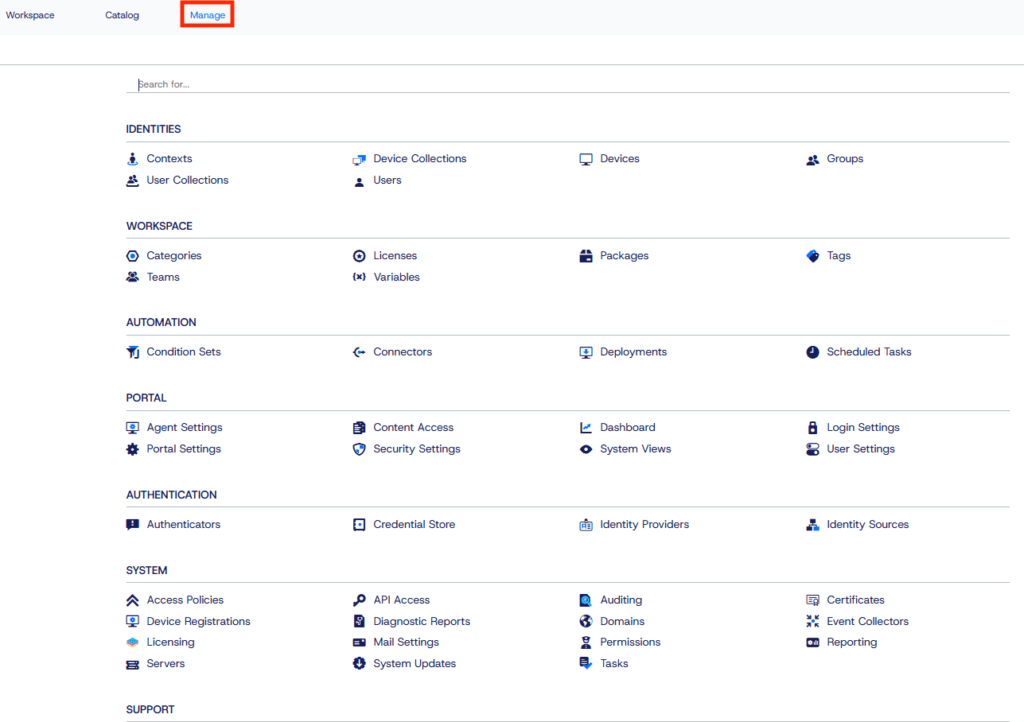
- Navigate to Manage.
-
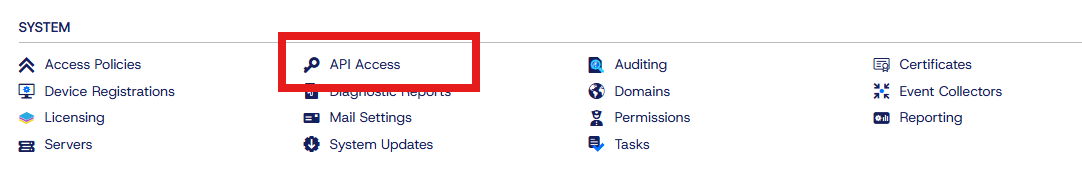
- Select API Access.

- Select API Access.
-
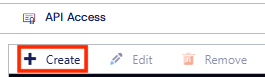
- Select Create.

- Select Create.
-
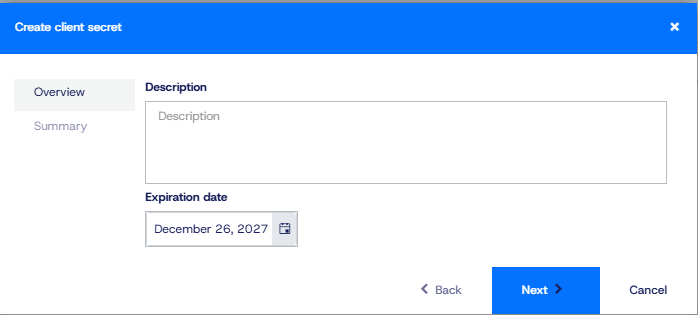
- Enter a description, set an expiration date, then click Next.

- Enter a description, set an expiration date, then click Next.
-
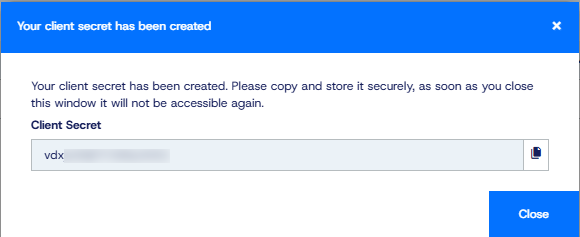
- Select Finish to generate the client secret.
-
- Copy the client secret and store it in a secure password vault.

- Copy the client secret and store it in a secure password vault.
-
- Once created, it will create an entry in the list. In the list, open the new entry (double-click it or select Edit). Then copy the username and store it with the client secret.
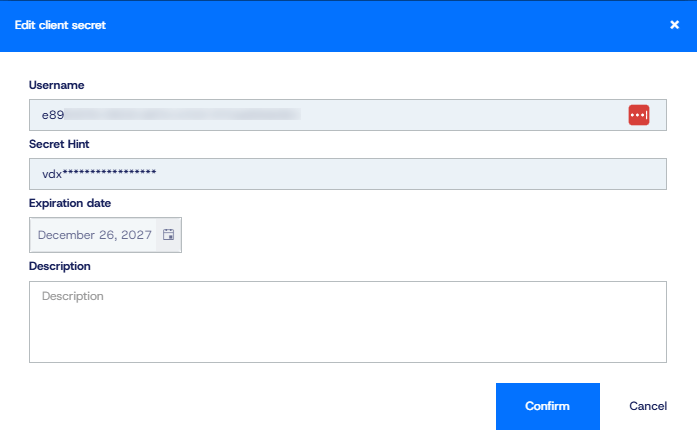
- Once created, it will create an entry in the list. In the list, open the new entry (double-click it or select Edit). Then copy the username and store it with the client secret.

-
- You now have the credentials you’ll use in Power BI. Save these somewhere safe. When the secret expires, you’ll need to generate a new one and update the record in Power BI.
Connect the template to your zone
Now you’re ready to open the template in Power BI Desktop. The easiest way is to double-click the template file. As this is a template, it will open a new dashboard file and use this template as its base.
Tip: Open the .pbit file directly (double-click). That helps you avoid accidentally editing the template itself.
When you open the template, Power BI will prompt you for your zone. Enter your zone in this format:
https://<virtual host>/api/reports/v4/ 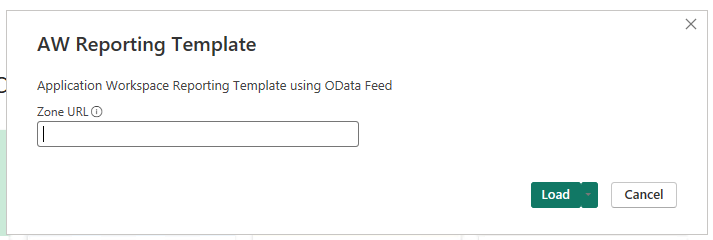
Replace <virtual host> with your zone name. Once you enter your value above, click Load. It will then attempt to connect to your zone. Once connected to your zone, it will prompt for credentials. 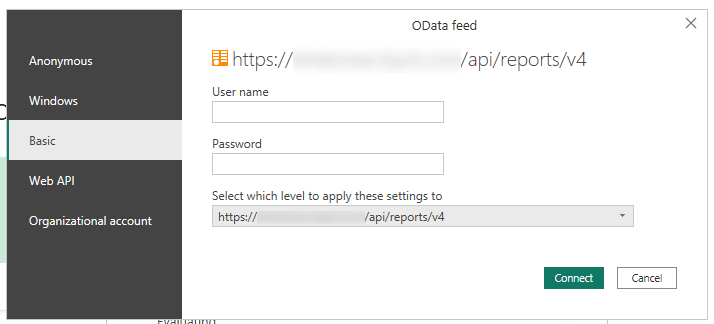
When prompted, choose Basic authentication and enter the username and client secret you created earlier. Leave the “level to apply these settings to” as its default, then select Connect.
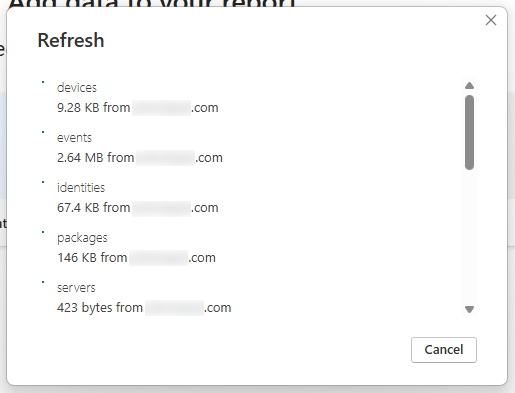
The template will verify credentials and then will start loading data. This may take a few minutes depending on how much data it is loading. It will only load the last 30 days of event data to keep it faster. If you have a lot of events, the first load can take a few minutes.
Once the data is loaded, you will now see in the template all the tabs that we created as well as how we connected everything. Power BI loads the data into a table-like structure. If you’ve done anything with databases, this follows the same theory. We then take those tables and define how they relate to one another.
Understanding how the model is built
Let’s walk through some of the key pieces you need to know about before we tackle the dashboards themselves.
When it first loads, it loads Report View. This is what your visualizations will look like, giving you a graphical representation. Before we dig into the dashboards, let’s cover two views that help you understand the data model. Let’s start with Model view.
Model View
The Model View is where you define the relationships between the different tables or data points. You can see the relationships we have defined when you switch to Model View. Select Model to open Model view:
![]()
This will show how we related all the data together so that we can report on it. Here’s what those relationships look like:
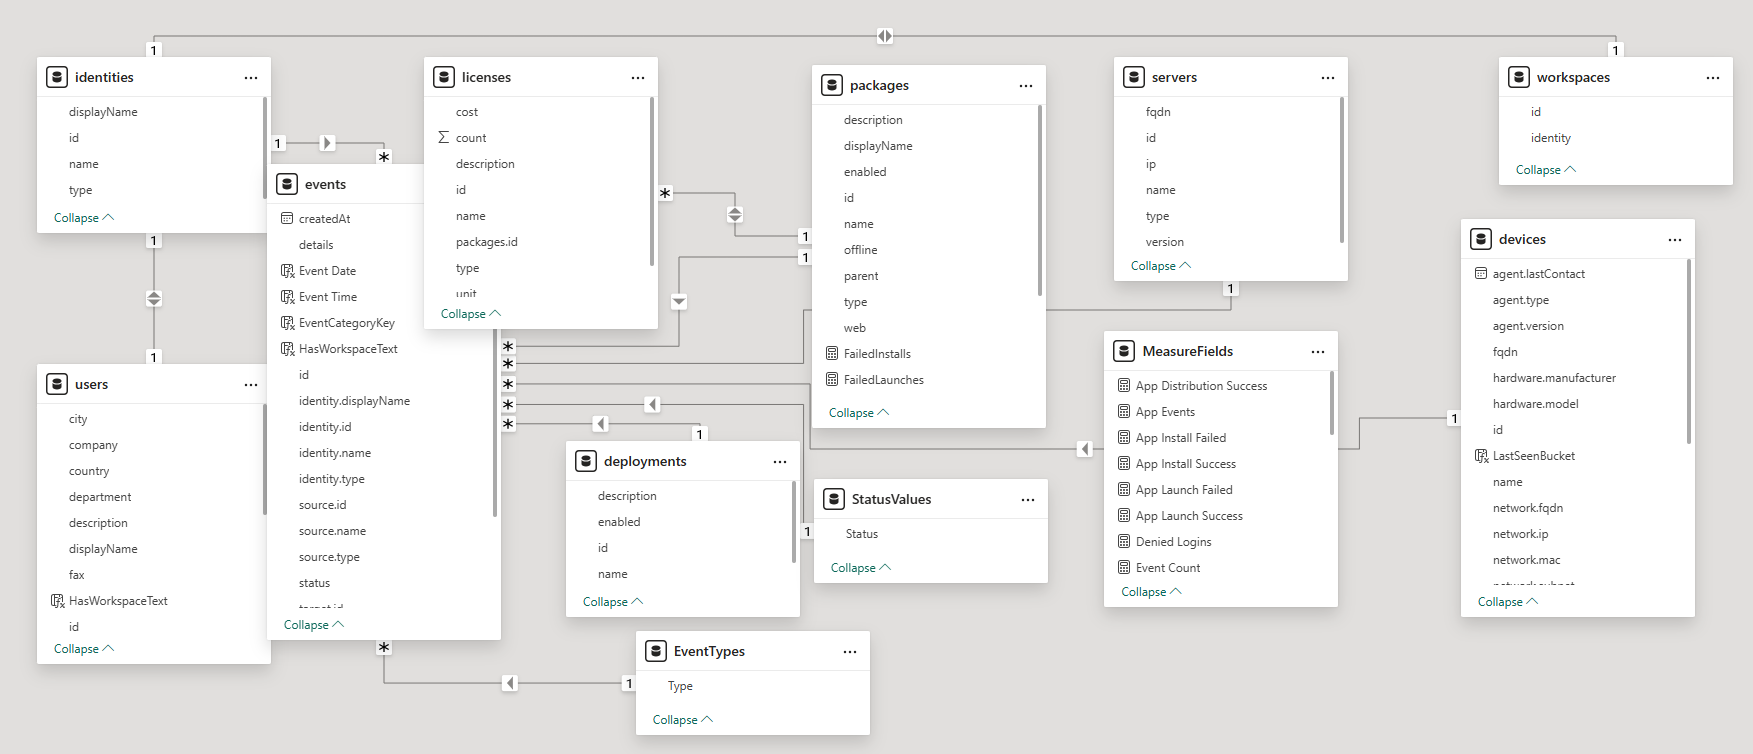
This information is for reference, so you’ll know what we’ve done if you add your own visualizations or create a new dashboard. As you can tell, we created a lot of relationships so that we can easily combine data points into connected attributes, bringing data from multiple places into one.
Table View
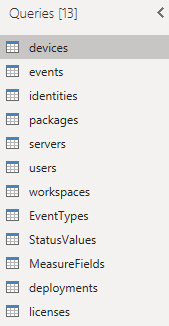
Next is Table view. In this view, you can see the data that is being pulled from the OData feed on a per-table basis. You can access Table View by clicking this button:
Once you are in Table View, you can just select the table on the right side of the window, and it will display the contents of that table.
Dashboard tabs in the template
Now onto the Report View. Here is where all our visualizations are, and I will go through each, one at a time.
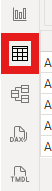
User Events
On the User Events tab, we can see user login information like whether login was successful or denied, as well as logoff events and failed logins. This can help you determine if there are issues with users logging into the system and how many times they are logging in. A spike in logins can also hint at device restarts or sign-in loops. You can further filter this down by date range or even by single or multiple identities.

User Info
This tab reuses some of the same data but focuses on whether each user has a virtual workspace. This can help in troubleshooting why users may or may not be able to see what’s available to them. For those of you who may be new to Application Workspace, every user gets what we call a “virtual” workspace. That is where all their package assignments reside. It controls Smart Icons and what the user can see. Every active user should have a workspace. If they don’t have one, there might be an issue. You can further filter this list based on Identity.
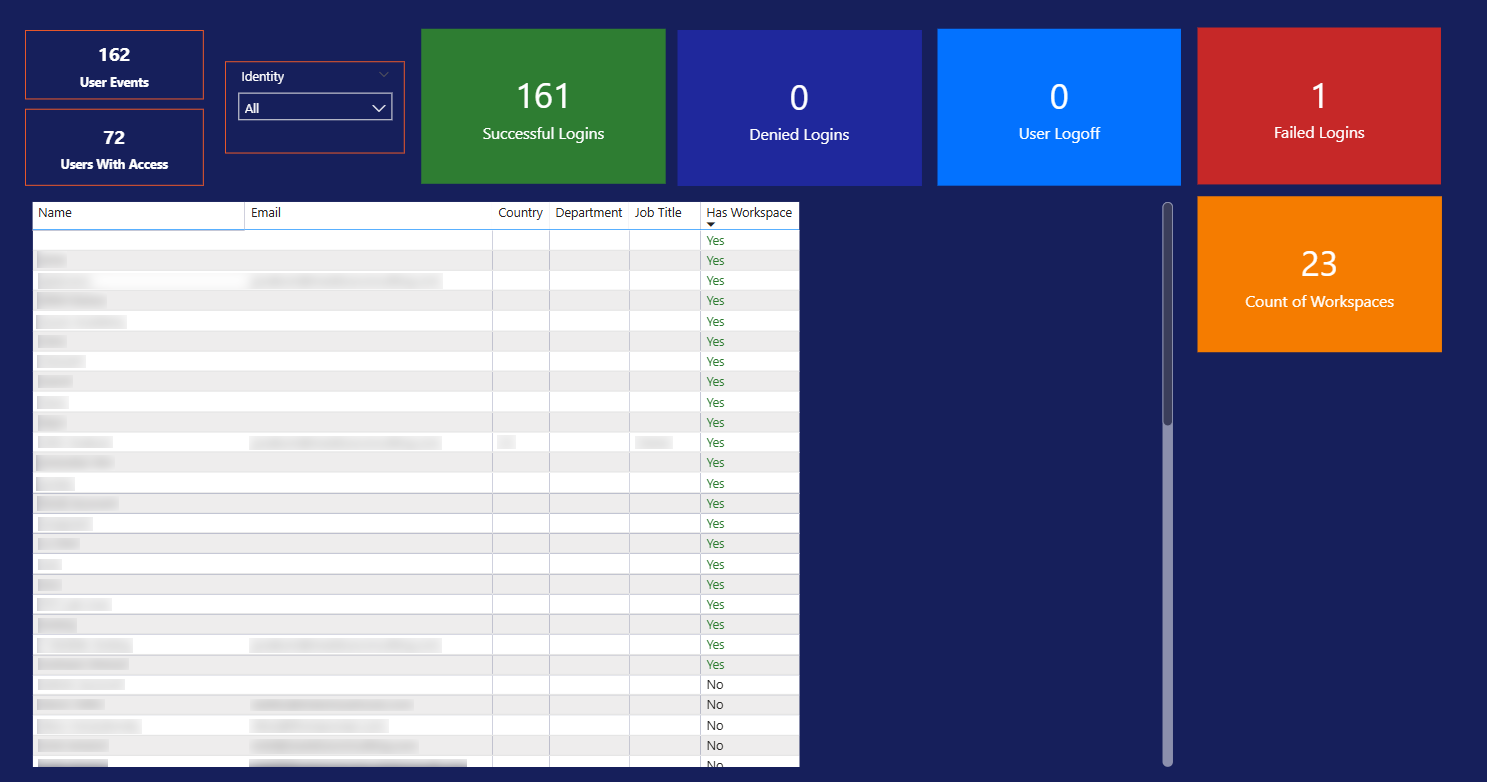
Application Events
This tab summarizes package health across distribution, installs, and launches, both successes and failures. Everything is summarized into a package health score whether it is for install or launches. The data can also be filtered by date range, package, or even down to which device you want to view.
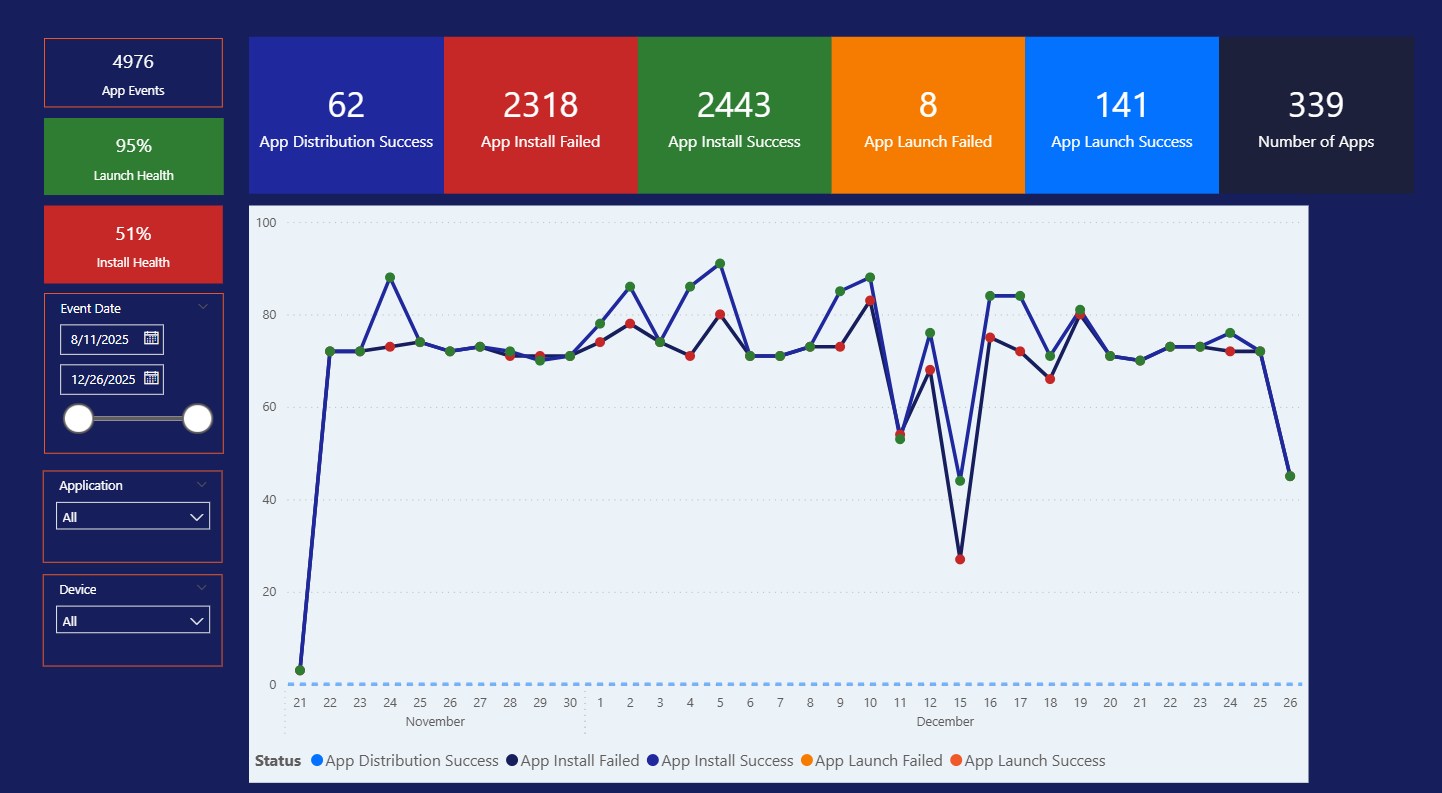
Applications
This tab repeats the theme from the previous tab, allowing you to see package health. However, we included a table that shows all packages in your environment and the launch and install health for each one. It also includes a drill down so that when you select a package, you can see all the devices that it successfully installed on or failed to install on. You can filter by date range, package, and device.
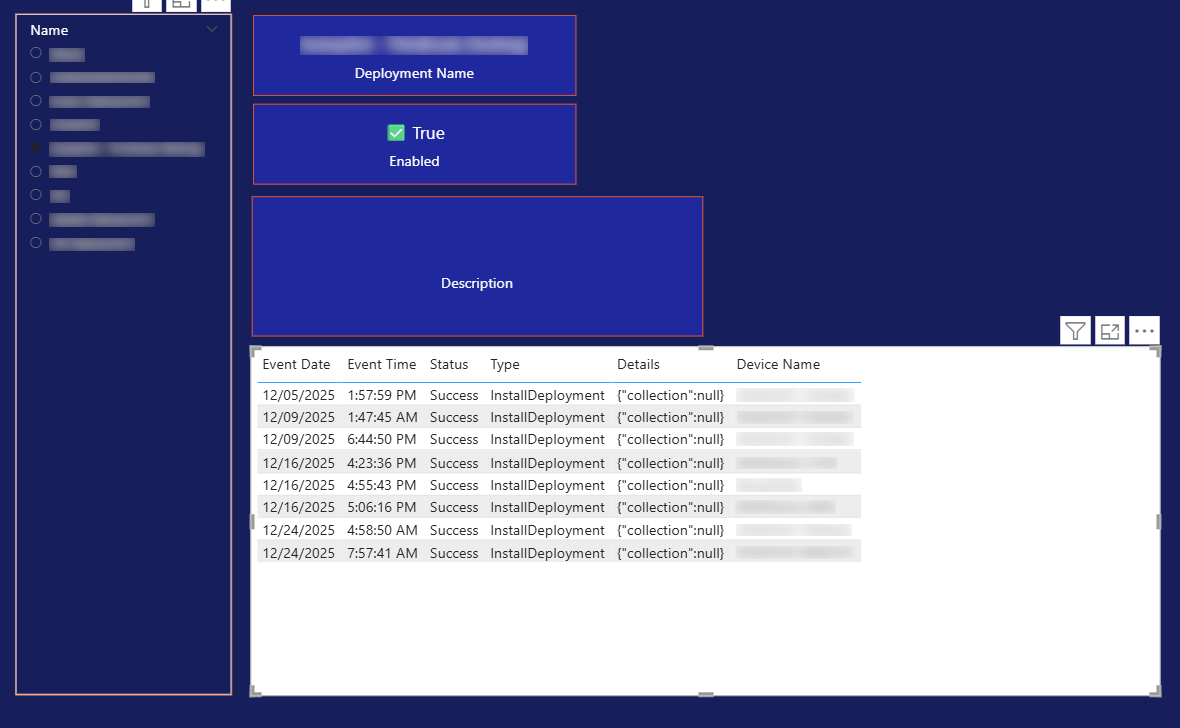
Deployments
Deployments in Application Workspace let you predefine a set of packages to install during agent installation. Think of it like provisioning, similar to Autopilot or OSD (Operating System Deployment). This tab shows you the successes and failures of those deployments on devices. You can select a specific deployment and review the results.
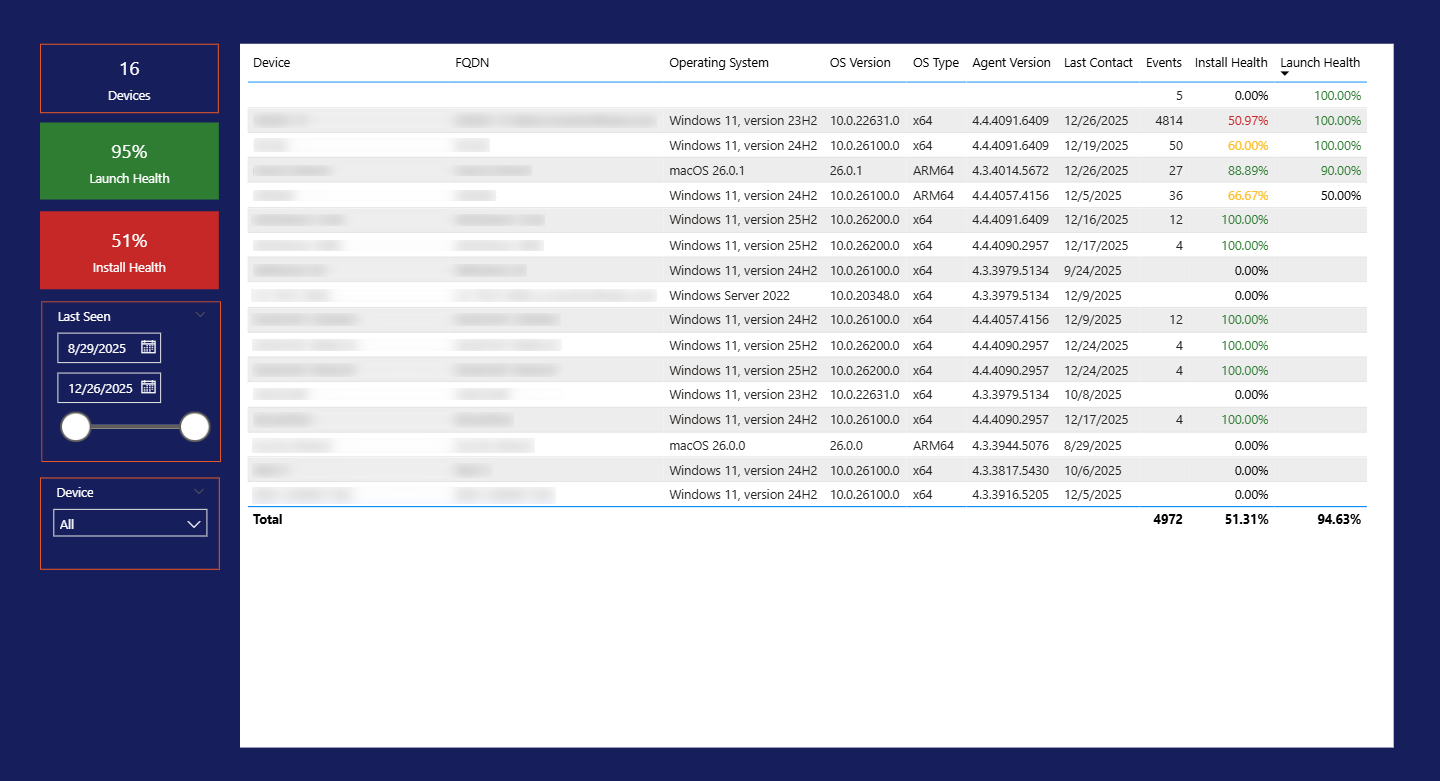
Endpoint Events
This tab is a quick view to see all your endpoints and the overall install and launch health for all the packages associated with those devices. This is based on the devices instead of the package like before. This report includes filters for date range and device.
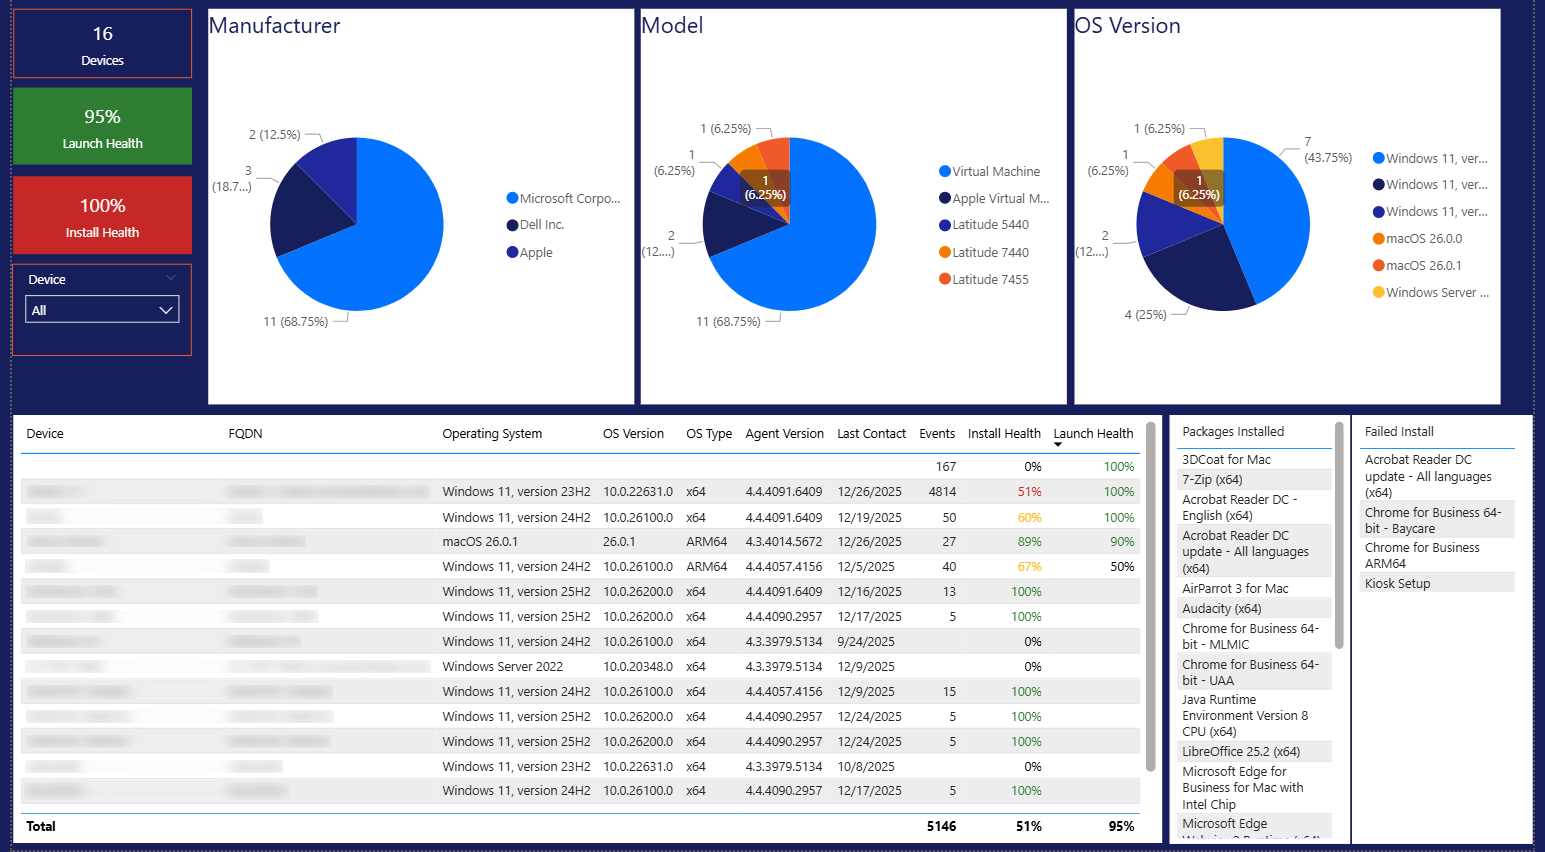
Endpoint Breakdown
This tab breaks down your device inventory by manufacturer, model, and OS version. If you select any of the pieces of the pie[s], it will filter down the list below. You can also see install and launch health for packages on those devices. This report also features per-device filtering. One of the other things we added was the ability to choose a device and then see all the packages that have been installed successfully or failed to install on that device.
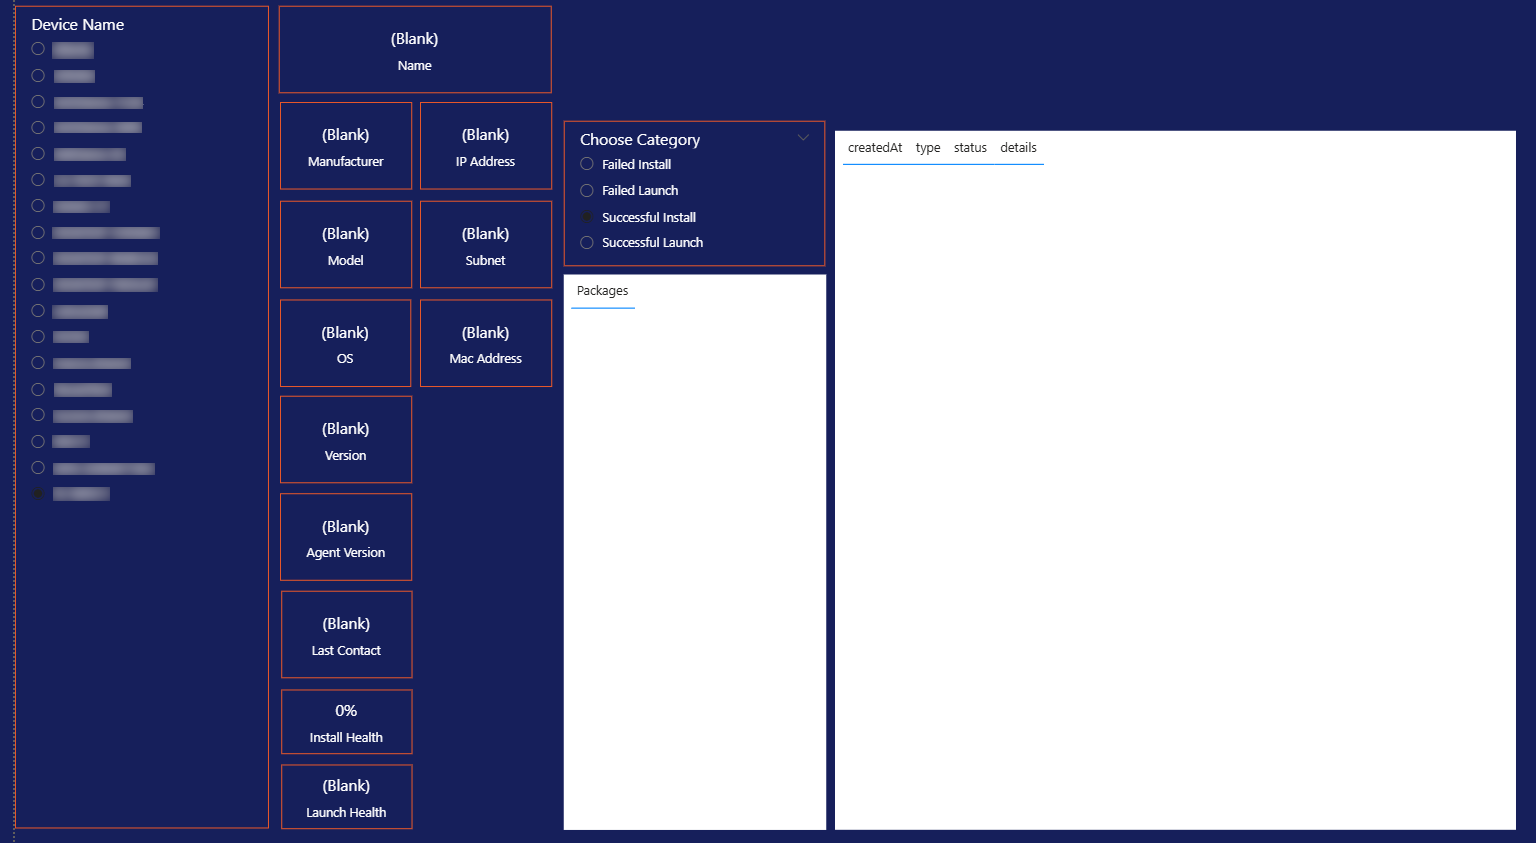
Endpoint Info
Select a device to see its event history and the device details stored on the server (model, OS, agent version, last contact, and more). You can also select a type of event and see all the event details for that event type for the device, giving you one place to look at all the information about a single device.
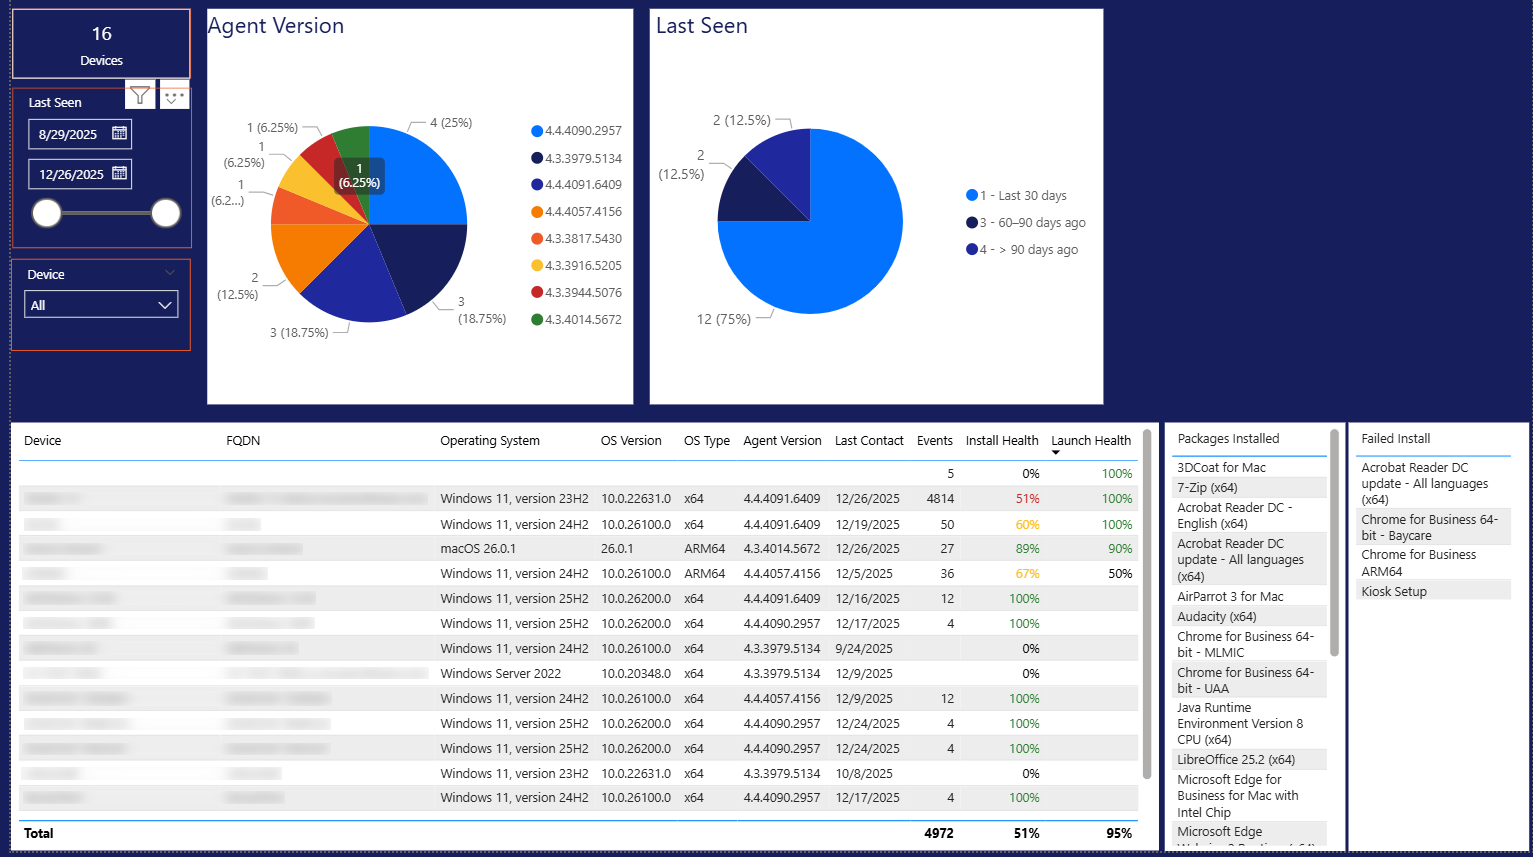
Agent Info
This tab will show you information about the Application Workspace agent on the devices. It shows a pie chart for all the different agent versions in your environment as well as another for when those devices were last seen by the server. We also included a listing again of all the devices. As you choose a piece of the pie, it will automatically filter the dataset to those that meet the right criteria. As happens in other tabs, selecting a device here will cause you to see all the packages that are successfully installed or failed to install for the selected device.
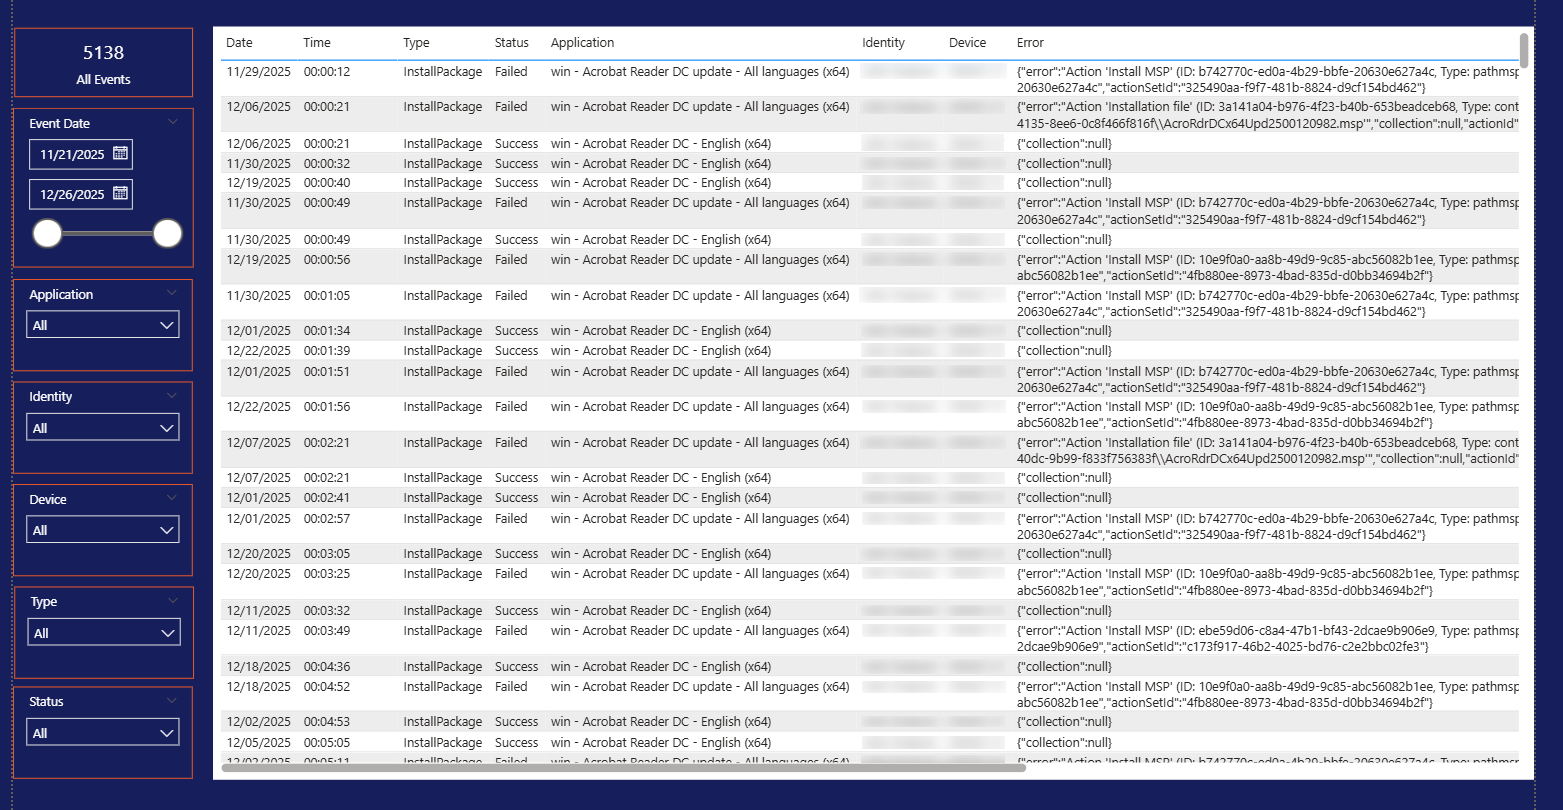
Event Details
This tab allows you to customize and see all the data in its raw form. You can use the filters to the left to isolate the exact data you are looking for, narrowing down the list of events.
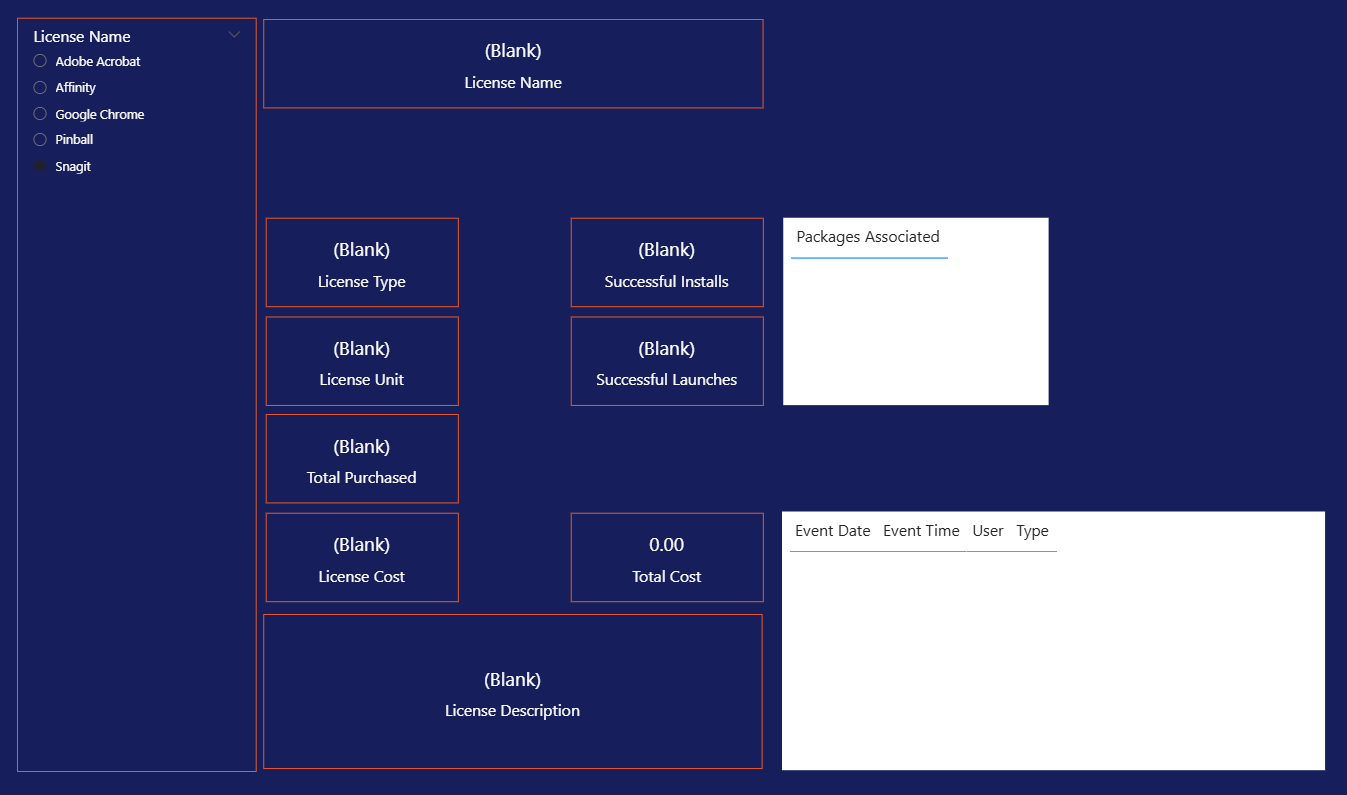
Licensing
We also included a licensing page, but it’s hidden by default while we expand the data. It is currently hidden from publishing as we want to include more information. It can be used as it is for now, but we have plans to extend these data points out a bit more. However, in its current state, if you are using licensing, you can use this tab to track usage for licensing objects.
What’s next
This is just the beginning of what we will be able to do with the OData feed. Over the coming months, we plan to expand what the OData feed exposes and update the template as those fields roll out.
Wrap up
As we discussed, this is a template, a starting point for all things reporting in Application Workspace. You can start with this and make it grow on your own, like adding additional KPIs that suit your organization. You can also bring in another data source and combine the data from both sources into a single dashboard. You could also build a custom ServiceNow connector that pulls in the OData for reporting. You can take this as far as you need—new KPIs, new pages, and even combined data sources. Happy reporting!
Additional resources
Application Workspace Documentation
-
- Application Workspace 4.4 Release Announcement – Full feature overview and release notes
-
- Application Workspace Reporting Documentation – Configuration and setup guidance
OData API Reference – Documentation of API Endpoints
-
- OData Feed Reference – Postman collection of all endpoints and descriptions
Power BI Resources
-
- Power BI Report Server – Microsoft Power BI
- Power BI documentation – Power BI | Microsoft Learn
Support
-
- Support – Recast