CMTrace is a real-time log file viewer for Microsoft Configuration Manager (ConfigMgr). I originally wrote a blog post about CMTrace back in 2014, so I thought that it was time to update it with new information about running it you can learn from. In this post, I’ll tell you why I like using CMTrace because you may have noticed that I often refer to it when I need to review ConfigMgr log files. I’ll also tell you where you can find CMTrace and I’ll give you a couple of helpful tips on how to use CMTrace to its full potential!
What Makes CMTrace a Must-Have Tool?
There are numerous reasons to use this tool, but here are a few of my favorites:
- Log files can be reviewed in real time as they are updated, which can save you time.
- Multiple log files can be merged together to be viewed as one file.
- You can highlight text based on your own needs as you work through the logs. Don’t underestimate this feature.
- Ability to look-up error codes.
CMTrace Reads All ConfigMgr Log Files
After working with ConfigMgr for a while you will realize that there are almost 200 different Configuration Manager log files. To help you understand what each log file does, the ConfigMgr documentation team listed and documented each one.
In order to open and view the complete list, here’s a link to the documentation. One of the things that you will notice on the update learning site, is that the logs are broken down by CM roles and functions. Making it easier for you to understand what logs to look at when troubleshooting an issue. This is particularly helpful when you are starting out with ConfigMgr.
Given that CMTrace can read each log file, I strongly encourage you to give CMTrace a try!
Where Can I Find CMTrace?
ConfigMgr
A while back the Microsoft Product team, included CMTrace as part of the CM client install. You no longer need to locate and install the Toolkit, just to find CMTrace. From a Run window type cmtrace and it should show up. If it doesn’t, you will find it under c:windowsccmcmtrace.exe.
For completeness, the toolkit tools still exist and are now included in the installation of ConfigMgr. These tools, which include CMTrace, are updated as required with each cumulative update (CU).
The toolkit is found under the Tools folder. In my case the path to cmtrace.exe is:
E:Program FilesMicrosoft Configuration Managertools.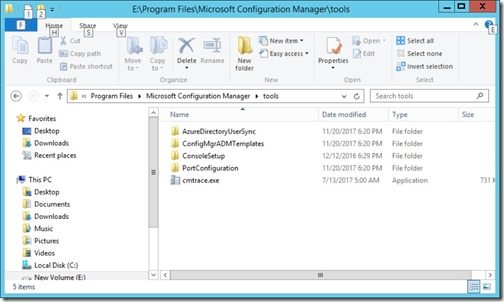
Don’t worry. When you first try to access the Tools folder, you will receive the following message: You don’t currently have permission to access this folder. Simply click on the Continue button, adjust the folder permissions and grant yourself access to the folder.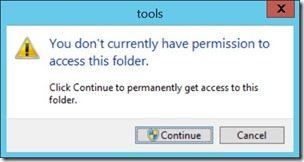
Usage notes about CMTrace:
A line highlighted in yellow generally indicates that there is a warning message, and a line highlighted in red generally indicates that there is an error message. BUT remember just because a line is highlighted in yellow or red doesn’t mean that it is a problem. You need to read the whole log file in context to determine if it is a problem.
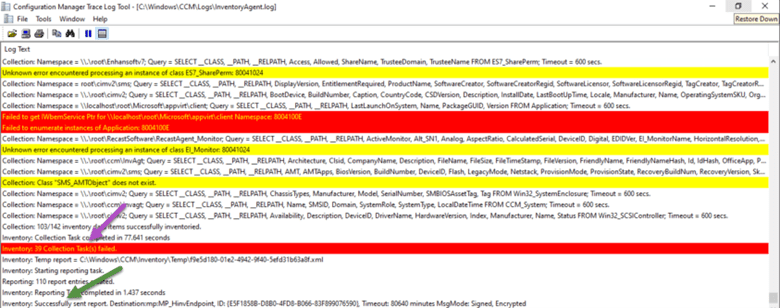
For example, if you look at the purple arrow and noticed the red highlighted line, you will assume that the hardware inventory failed. But if you looked closely a few lines later you will see that the inventory was sent to your MP correctly. Context is important when reviewing the log files.
Error Message Lookup
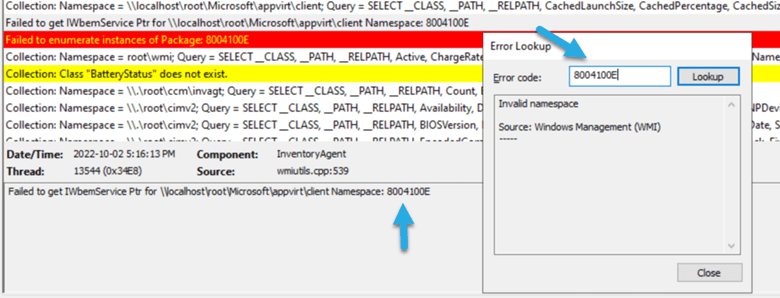
In CMTrace, using the log snippet below as an example, I copied the 8004100E error code and open Error Lookup window using the Ctrl-L command. Then pasted the error code before click Lookup button. From there I can see what this error message means in plain text. Thereby pointing me in the right direction. In this case I already know that App-V is not installed and therefore the WMI namespace doesn’t exist, so this error is to be expected. Which makes it not really an error.
Highlight Lines
If you are troubleshooting something within the ConfigMgr logs it can be useful to highlight the item in order to see it happen in real-time.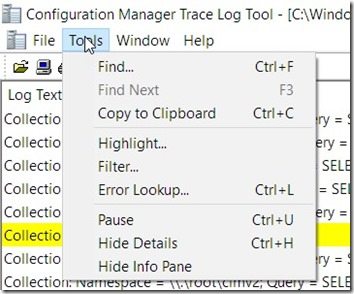
To do this within CMTrace, click on the Tools and Highlight… menu items.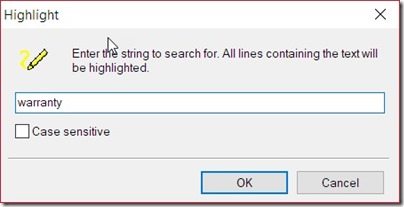
In the Highlight text box enter the text that you want to highlight and then click on the OK button.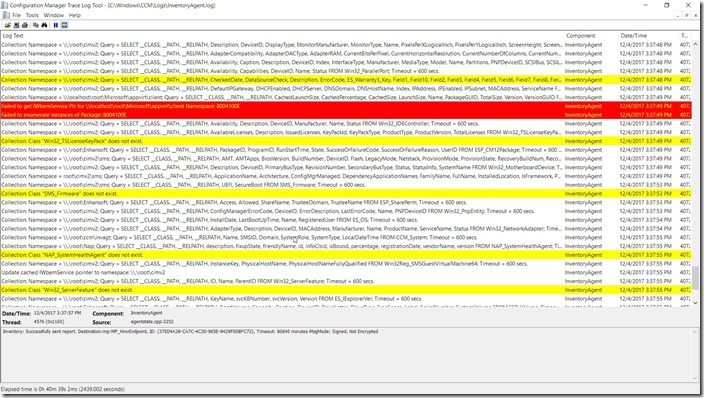
All instances of the text will be highlighted within the log file.
By default, the highlighted text will be shown in yellow. Since this can lead to some confusion because warning messages are also in yellow, I recommend changing the color to something different. See my next section on how to do that.
Without changing any of the colors, can you tell which one of the lines above has the highlighted text?
Pink Highlighted Lines
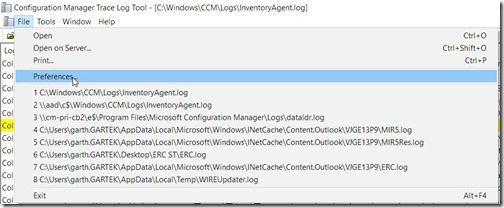
To change the default highlighted color, select the File and Preferences… menu items.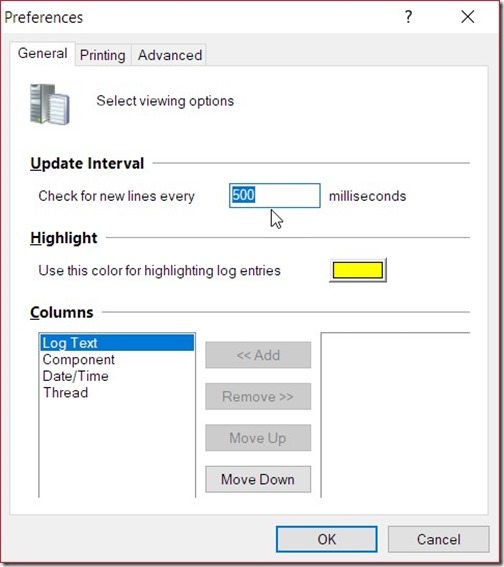
Click on the yellow box next to Use this color for highlighting log entries.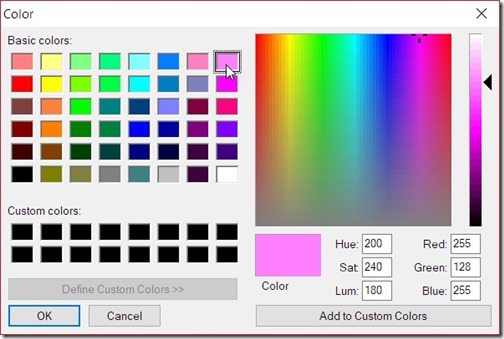
I find that using the color pink really stands out! However, you can use whatever you like, so choose a color and click OK.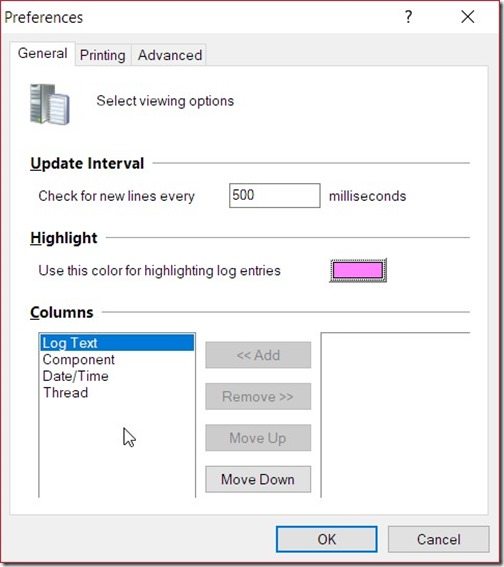
Finally, click on the OK button. Now all of my highlighted text will be displayed in pink.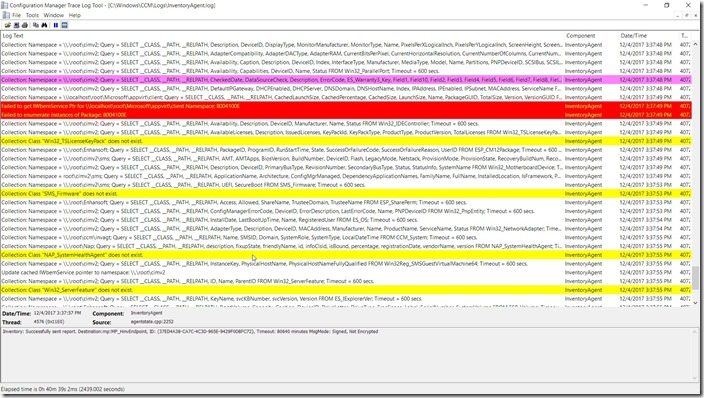
Now you can tell from the screenshot above what line has the highlighted text! In my opinion, you need to change the color of the highlighted text in order to quickly see it, and I think that the color pink is a great alternative.
To see these tips live, view my video demonstration!
Frequently Asked Questions (FAQs)
CMTrace is designed to be a lightweight and versatile tool, compatible with all recent versions of Windows that support Microsoft Configuration Manager (ConfigMgr). There are no specific system requirements beyond those needed for ConfigMgr itself. However, for optimal performance, it is recommended that your system aligns with the requirements of the ConfigMgr version you are using.
CMTrace stands out for its real-time log file monitoring capabilities, a feature not universally available in all log file viewers. Its ability to merge multiple log files for concurrent viewing and its unique text-highlighting functionality tailored to the user’s needs are particularly noteworthy. Compared to other tools, CMTrace is specifically optimized for ConfigMgr log files, providing a tailored experience that includes error code lookup and interpretation. While other tools might offer broader log management capabilities, CMTrace’s integration and specialized features for ConfigMgr environments make it a preferred choice for many IT professionals.
Advanced troubleshooting with CMTrace involves a nuanced understanding of ConfigMgr log files and the common issues that may arise. The tool’s error lookup feature is invaluable for decoding error messages and pointing administrators in the right direction. When encountering an error, use CMTrace to highlight the error code and related messages to understand the context. Always consider the sequence of events leading to the error, as the root cause may be earlier in the log file than the error message itself. For complex issues, leveraging CMTrace’s ability to merge and simultaneously review related log files can provide a comprehensive view, aiding in the diagnosis of interconnected system behaviors. Remember, effective troubleshooting with CMTrace is as much about understanding the tool as it is about interpreting the logs in the context of your ConfigMgr environment.


