


Advanced Endpoint Analytics in Intune is designed to improve user productivity by offering insights into potential slowdowns in device performance. It integrates startup performance analysis, application reliability monitoring, and proactive remediation scripts to identify and rectify issues before they impact users, thereby enhancing device efficiency.
In this post I provide a detailed overview of Advanced Endpoint Analytics, highlighting its key features:
- Overview with Anomaly Detection, Model and Device Scores
- Startup Performance
- Application Reliability
- Work from Anywhere
- Resource Performance
- Remoting Connection
- Battery Health
Previously, proactive remediation scripts were a standout feature, but they have since been appropriately moved to the device section.
Prerequisites for Utilizing Endpoint Analytics
The main prerequisite is to fulfill the license requirements. Here a valid Intune license is required.
Intune:
- Intune enrolled and Entra (hybrid) joined devices > Win10 1903 with cumulative update July 2021.
- Network whitelisting primarily for https://*.events.data.microsoft.com.
- Intune Service Administrator Role to activate the data gathering.
SCCM:
- Config manager and client 2002 with KB4560496
- Microsoft Intune tenant attach
- Enabled for Endpoint Analytics device upload
To read the results one of the following roles are needed:
| Role name | Microsoft Entra role | Intune role | Endpoint Analytics permissions |
| Global Administrator | Yes | Read/write | |
| Intune Service Administrator | Yes | Read/write | |
| School Administrator | Yes | Read/write | |
| Endpoint Security Manager | Yes | Read only | |
| Help Desk Operator | Yes | Read only | |
| Read Only Operator | Yes | Read only | |
| Reports Reader | Yes | Read only |
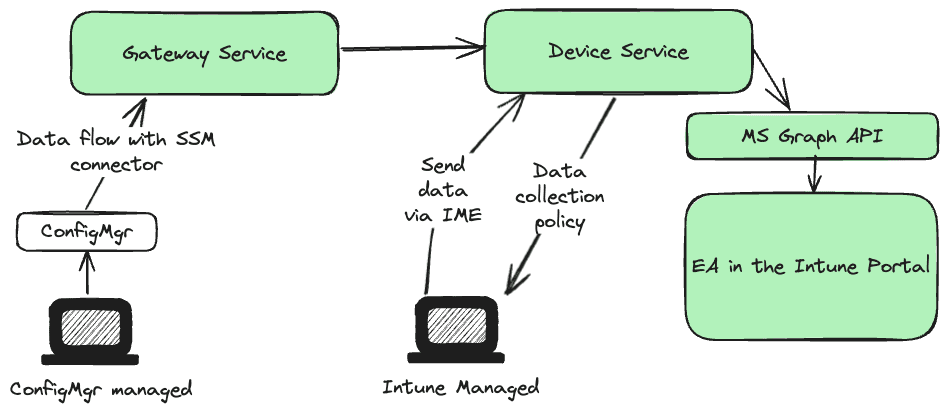
Data Flow for Advanced Endpoint Analytics in Intune
For Intune devices, data collection policies are assigned by default but can be customized. The information, collected directly from the built-in Windows client via the Intune Management Extension (IME), is sent to the Device Service connected to many other services via MS Graph.
SCCM devices have a different data flow, lacking a direct connection to Intune, which exempts them from needing a direct internet connection. These devices send data to SCCM every 24 hours, which is then forwarded hourly to the Gateway service, mirroring the Intune managed flow thereafter.
Modules Overview
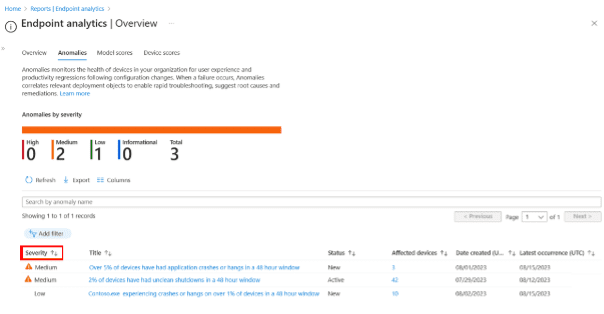
This section offers a comprehensive scoring of your environment across various subcategories and an overall score, alongside insightful recommendations. Anomaly detection, part of the Intune suite requiring an additional license, alerts you to significant environmental changes, such as an unusual number of app crashes or blue screens. You can also set a baseline for a score you want to reach.
Anomaly detection is another useful feature that is part of the Intune suite and requires an additional license. Anomaly detection shows you when you have significant changes in your environment like an unusual number of app crashes or bluescreens. It also helps you to determinate the cause by devices groups. Here you can find similarities between devices with anomalies, like those with the same model or OS version.
This anomaly detection feature uses different models:
- Threshold-based heuristic model
- Paired t-tests model
- Population Z-score model
- Time Series Z-score model
Device Timeline and Scores
The enhanced device timeline allows for the tracking of a device’s history, including app crashes and boot events.
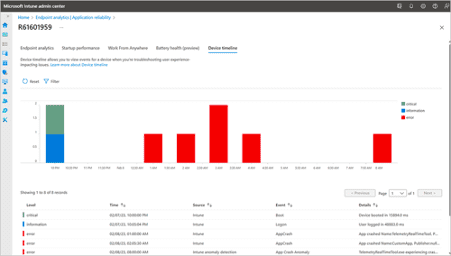
Device scores provide comparisons based on startup performance and app reliability, among other factors.
Startup Performance
This report details boot behavior, highlighting time spent at each step and identifying resource-consuming processes.. You can filter by models to see which ones take the longest time to boot. Furthermore, it offers insights into restart reasons, such as updates or user-initiated restarts due to system failures.
This report is designed like the others. Everything starts with an environment scoring page where you see interesting key metrics like a core boot score (Start of Windows) or a sign-in score (Login time). However, you also find other information like how GPOs influence this time.
You can then drill down to model, device, and startup process performance. In the restart frequency, you also see a nice chart that showcases the per device average for the different restart reasons, like updates in the last 30 days.
Application Reliability
Application Reliability in Advanced Endpoint Analytics crucially identifies and analyzes app crashes, offering insights into the frequency of installations and crash incidents across varying Windows versions, app versions, and device models. This feature enables pinpointing devices prone to higher crash rates, highlighting the need for immediate attention. It utilizes metrics such as the average time between app crashes and overall app reliability scores to flag underperforming applications.
The devices needing attention are flagged with data on how many app crashes or app hang ups they experienced. Interesting metrics include the mean time of app crashes (avg minutes per app crash) or the app reliability score.
Regularly reviewing these metrics is essential for maintaining application stability and end-user satisfaction.
Work from Anywhere
This report evaluates your readiness for remote work via the key “work from anywhere” score. This score includes data on Windows (which version is installed and Windows 11 readiness), Cloud identity (are the devices joined in the AAD), Cloud management (are the devices managed with Intune), and Cloud provisioning (are the devices enrolled / registered to Autopilot).
Resource Performance
The Resource Performance report helps you optimize vCPU and RAM utilization on Cloud PC devices. The report features four tabs: Resource Performance Score, Model Performance, Device Performance, and Device History, offering comprehensive insights into resource management.
- The Resource Performance Score, rated between 0 to 100, reflects the efficiency of CPU and RAM usage based on CPU and RAM spike times (with spikes considered over 50% usage). This scoring system aids in identifying performance bottlenecks and setting performance baselines, either at the organizational median or a custom value. Insights and recommendations provide actionable steps to improve resource allocation and device performance.
- The Model Performance and Device Performance tabs enable administrators to analyze resource usage across different Cloud PC models and individual devices. For devices below baseline performance, adding resources or resizing actions are recommended. This proactive management strategy ensures Cloud PCs are optimized for performance, supporting high productivity levels.
Remoting Connection
This report analyzes the efficiency of connections to Cloud PCs, presenting performance metrics that are helpful for optimizing your organization’s remote work capabilities. This report is designed to deliver comprehensive insights into connection quality and speed, helpful for ensuring a productive remote work environment.
Key Performance Metrics:
- Round Trip Time (ms): This metric signifies the duration required for data to travel from a user’s device to the Cloud PC and back. It is a critical indicator of connection quality, directly impacting the user experience. The report meticulously displays both the median and the 95th percentile values of the latest metric readings, offering a dual perspective on performance with classifications into “Good” (0-100 ms), “Average” (100-200 ms), and “Poor” (over 200 ms).
- Sign in Time (sec): This metric accounts for the total duration needed for users to establish a connection to their Cloud PC. Similar to the Round Trip Time, it provides median and 95th percentile values of the latest readings, categorizing the performance as “Good” (0-30 seconds), “Average” (30-60 seconds), and “Poor” (over 60 seconds).
Battery Health
The Battery Health report requires an Intune Advanced Analytics subscription and is accessible to battery-powered devices managed by Intune or co-managed. The report provides a comprehensive view of battery health, including a battery health score that combines capacity and runtime scores to identify batteries needing replacement. Insights prioritize issues like low battery capacity and poor runtime, offering recommendations for improvement, including potential warranty replacements. Detailed tabs within the report—Device Performance, Model Performance, OS Performance, and App Impact—offer granular data on battery performance across devices, models, and operating systems, as well as the impact of specific apps on battery life.
Limitations include data outliers and lack of availability in certain scenarios, but the report remains a resource for proactive battery management. By leveraging these insights, organizations can improve device usability and user satisfaction, preemptively addressing hardware issues before they impact productivity.
Conclusion: Advanced Endpoint Analytics in Intune
Advanced Endpoint Analytics strives to help IT administrators enhance device management, performance, and user productivity within their organization. Through its reports on Application Reliability, Resource Performance, Remoting Connection, and Battery Health, it equips teams with insights and metrics to proactively address issues, optimize resources, and ensure an improved operational experience. Whether it’s improving app stability, managing Cloud PC resources, ensuring efficient remote connections, or maintaining device battery health, Advanced Endpoint Analytics helps teams maintain higher performance and productivity standards in their IT environments.
Additional Intune Posts
Mobile Application Management (MAM)
- Mobile Application Management for Android Devices with Intune
- How to Set Up Mobile App Management with Intune
Local Administrator Password Solution (LAPS) & Security
- How to Set Up Windows LAPS with Microsoft Intune
- Step-by-Step Guide: Enabling Windows LAPS in Entra ID
- Configure BitLocker on Windows Devices with Intune
- How to Configure Bitlocker with Intune
Policy Management & Migration
- How to Migrate Group Policy Objects to Microsoft Intune
- How to Set Up Free Microsoft 365 Developer Program
Application Deployment
Inventory Management & Custom Reporting
Windows Management & Upgrade