


There’s a lot of talk online, in numerous Microsoft Endpoint Configuration Manager (ConfigMgr/MEMCM) forums and groups, about ConfigMgr collections. Why? They can take a long time to update after being edited and that can be very frustrating. In order to help you out with troubleshooting collections, the Microsoft ConfigMgr product team introduced the Management Insights feature back in version 1802. This blog post, however, is NOT about Management Insights. Instead I’m taking a closer look at the Collection Evaluation Viewer (CEV). I’m training my sights on this because, by far, the biggest reason for slowly updating collections is poorly written WQL queries. CEV not only helps you to find these collections, but when the queries are finally fixed you will be able to see the difference it makes.
Now, I know that I said this blog post wasn’t about the ConfigMgr Management Insights feature, but that should be where you look in the first place for poorly performing collections. Why there first? The answer is simple. You spend most of your life within the console, so each month make it a habit to check all of the Management Insight information. Then you can dig deeper with CEV when there is an issue. In case you are looking for more troubleshooting tips, I wrote a post about it last year, ConfigMgr Management Insights for Collections. Once you have identified the collections and can’t seem to fix the problem, this is where this blog post comes into the mix.
Why Use Collection Evaluation Viewer?
Before I answer this question, here are some reasons why collections may take a long time to update:
- The SQL Server CPU is overloaded.
- SQL Server disk I/O (input/output) is either too little or too slow.
- There’s not enough RAM, so memory paging occurs.
- Using an underpowered virtual machine (VM).
- There may be too many collections updating at the same time.
- A poorly designed WQL query.
The last item on this list is why you need to use CEV. It is now quite common for ConfigMgr admins to no longer, “own,” their physical ConfigMgr server. In most cases ConfigMgr is VM-hosted and managed by another team. We all know what it’s like to ask another team to review the server and fix, “slowness issues,” so before you do that you should review your ConfigMgr setup. Make sure that you are not the root cause of the problem with poorly written WQL queries. Use CEV to identify poorly performing collections and then remove or update as many of the WQL queries as you can.
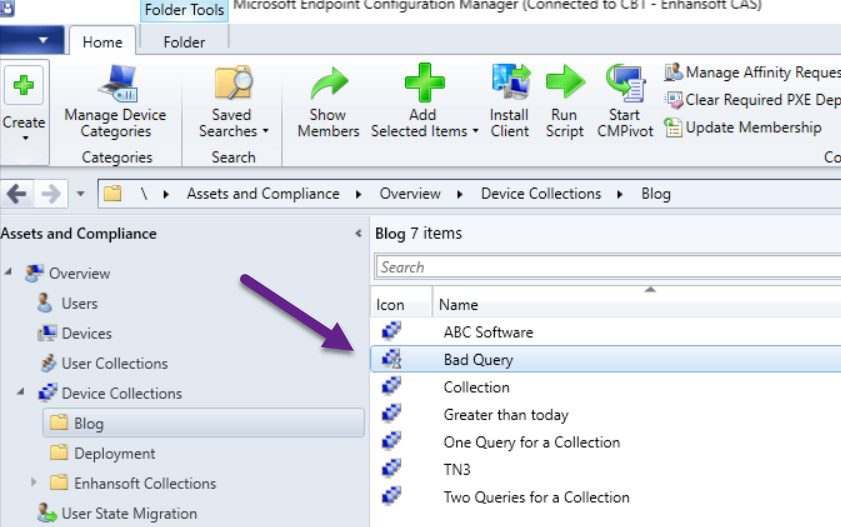
Bad WQL Query
You may need some convincing that a poorly written WQL query will cause ConfigMgr to work harder than it should, so I’m going to prove it to you. Below is an example of a bad WQL query.
select
SMS_R_SYSTEM.ResourceID,
SMS_R_SYSTEM.ResourceType,
SMS_R_SYSTEM.Name,
SMS_R_SYSTEM.SMSUniqueIdentifier,
SMS_R_SYSTEM.ResourceDomainORWorkgroup,
SMS_R_SYSTEM.Client
from
SMS_R_System
inner join SMS_G_System_COMPUTER_SYSTEM on SMS_G_System_COMPUTER_SYSTEM.ResourceId = SMS_R_System.ResourceId
where
SMS_G_System_COMPUTER_SYSTEM.Manufacturer not like “%Microsoft%”
and SMS_R_System.OperatingSystemNameandVersion like “%workstation%”
Want to know how long ConfigMgr takes to process a poorly written query?
If you open the Colleval.log, you will see how long it takes to update a collection. Please remember that if you have a CAS, you need to look at the Colleval.log on EACH primary server.
The highlighted line in the log file below shows the processing start time for the bad query in my example. The query took 1.578 seconds to be processed.
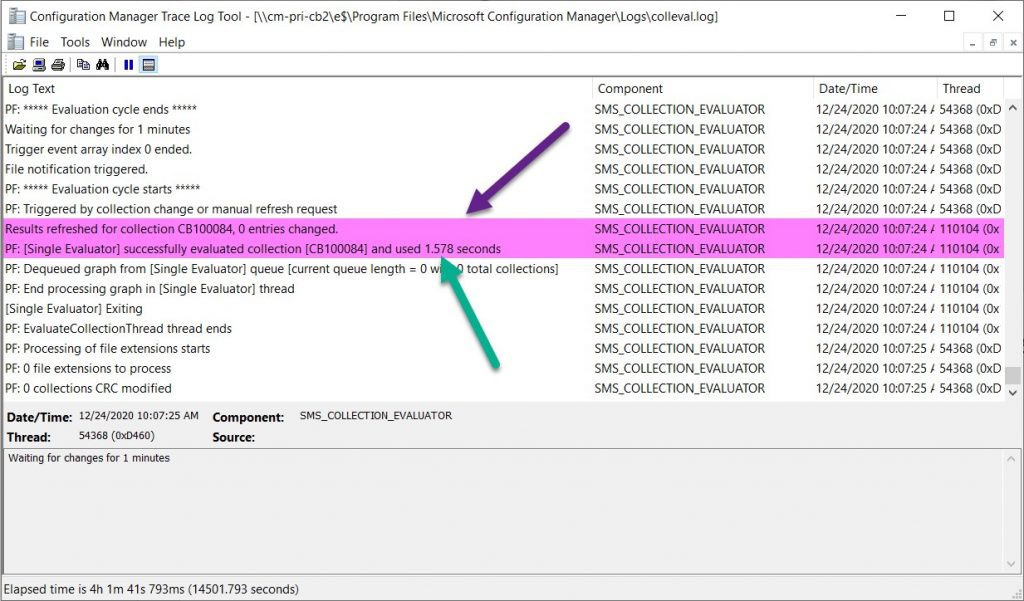
Now I’m sure many of you are saying that 1.578 seconds is not a long time. That is true but, what you don’t know is that there are only 42 ConfigMgr client computers in this lab. This equates to roughly 0.038 seconds per computer.
There are a million factors that can impact the speed of your query. Are the columns indexed? Is your SQL Server local to your provider? Are you using a VM or a physical server? Are you using SATA or SSD for hard drives? Did SQL Server cache the results? You get the picture! Let’s assume for the sake of argument, that there is a linear line from the more computers you have to the longer it takes to run a query.
[wptb id=28868]
With as little as 2,000 computers, this query will take over a minute to run! What about 50,000 computers? Now, you are talking about over half an hour. How do you find these problem collections? I’m not suggesting that you read the log files for every query. Instead I recommend using CEV to quickly review the stats for all of your collections. This way you can work on updating your “bad” WQL queries right away. In another post, How to Fix a Poorly Written WQL Query, I give you some tips for how to write good WQL queries.
Collection Evaluation Viewer (CEV)
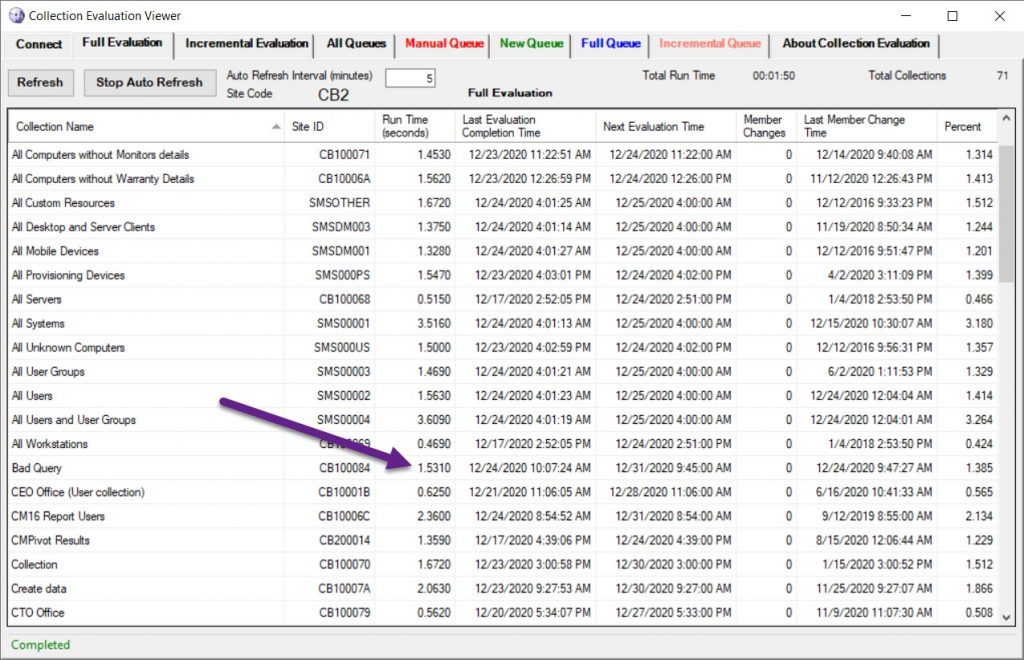
As you can see from the screenshot above, the Bad Query takes 1.5310 seconds to process. Isn’t this format a lot easier to read when compared to the Colleval.log? You can quickly see what collections need their membership rules reviewed by checking the run time for each collection.
Where Can You Find CEV?
Collection Evaluation Viewer (CEV) is available on any primary site server. It’s located under toolsServerTools and ceviewer.exe is the file name. I sometimes copy the whole folder to my computer or run it directly from the UNC path.
Certificate Chain Error
If you run CEV on your own computer, you might get a certificate chain error. In order to solve this problem, check out my blog post, Collection Evaluation Viewer and Certificate Chain.
So, the next time you go to update the collection membership and see the dreaded hourglass, remember this post! If you have any questions, please free to contact me @GarthMJ.