Endpoint Insights
How to Add Alternating Row Colors to SCCM Reports
Topics: Endpoint Insights
Have you ever tried reading a very wide SCCM table or matrix report without alternating row colors? I have and I must admit that it’s no fun when you’re trying to figure out which value in the last column goes with what computer name is found in the first column.
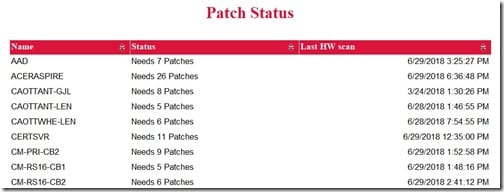
Take this simple report; because of the fairly large gap between the Status column and the Last HW scan column, it is easy to lose track of which date matches up with which computer. What’s the solution? It’s easier to view the information in table and matrix reports when the row colors alternate, regardless of the width. This is why you’ll always see this feature used in the built-in System Center Configuration Manager (SCCM) reports.
Creating your own reports? You’ll need to use this feature too! In this blog post, I will show you step-by-step how to add alternating row colors to your own SCCM table and matrix reports. This feature is one of those little gems that when leveraged, it can help take your reports to the next level.
Alternating Row Colors – The Break Down
Below is the code to perform alternating colors within a table or matrix report.
=iif(RowNumber(Nothing) Mod 2, “#ffffff”, “#c0c0c0”)
How does the alternating color code work? First, it determines the row number in the table or matrix. It does this by using the built-in feature called RowNumber. Next, it performs a modulo operation on the row number using the number 2 as the divisor. The outcome will be either 0 or 1 for any row. In other words False (0) or True (1). Next, the code uses the decision function IIF (about midway down the page) in order to determine the color background. The IIF function returns one of two values depending on whether the expression is true or false. If the value of the IIF is True, it will return the first value #ffffff (that’s the color white). If the value is False, then it will return the second value #c0c0c0 (that’s the color silver) within the IIF statement.
Adding Alternating Row Colors to a Table or Matrix
I’ll use the Patch Status report from earlier in this post as my example. You’ll see that adding this feature to your report doesn’t take long at all.
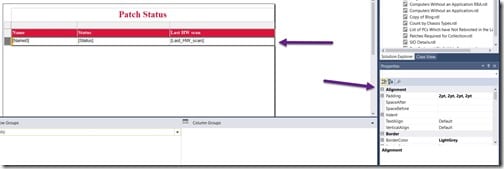
Start by selecting the first column value in your table or matrix.
Pro Tip
Instead of selecting each column value one at a time, in order to update the background color, try selecting the whole row which will update them all at once. This is what I am doing in the above screenshot.
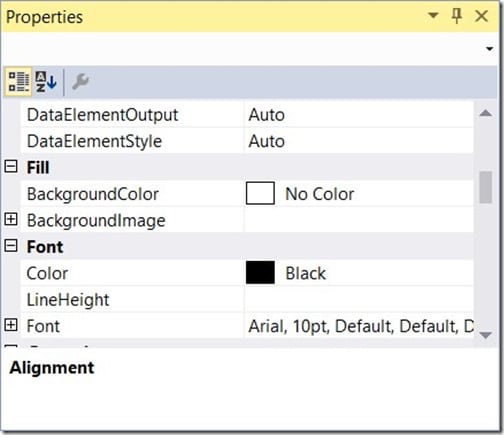
Once the entire row is selected, scroll down within the Properties window to Fill. This is where you’ll find BackgroundColor.
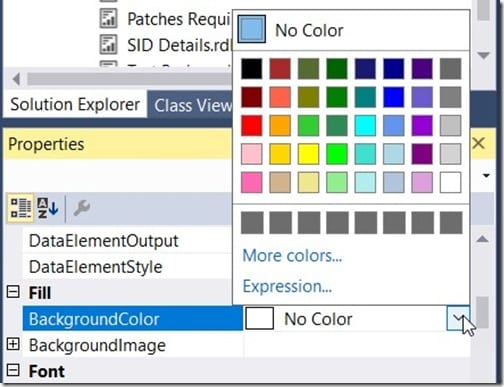
Click on No Color in the BackgroundColor box and click on the down arrow; next click on the Expression… link.
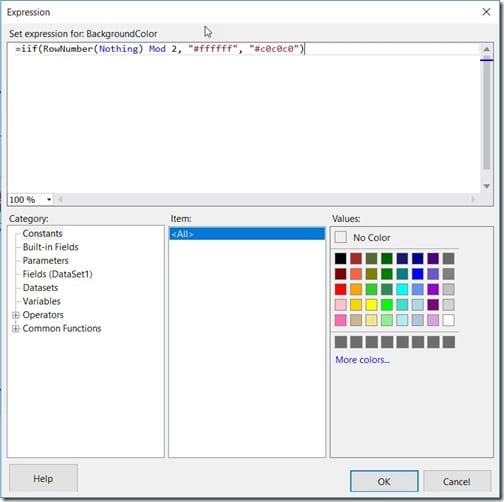
In the Expression window, replace the No Color text with the expression in the Alternating Row Colors – The Break Down section above. Once completed, click OK to close the window. Now I’ll run the report.
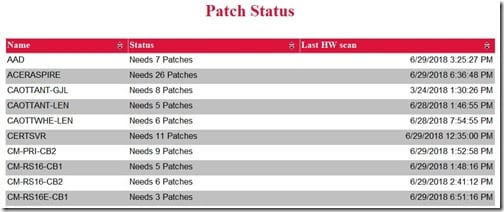
Isn’t this report now easier to read? Doesn’t alternating row colors help give this report a more professional look? This is one of those tips that helps to take your report or dashboard to the next level. Reports without this feature look unfinished. Take it from me!
If you have any questions about how to add alternating row colors to your table or matrix, please feel free to contact me at @GarthMJ.


