Endpoint Insights
How to Add the Last Refreshed Date and Time to a Power BI Report
Topics: Endpoint Insights
Have you ever wondered, “How old is the data within this report?” Once you load data within a PBIX file and report on it, if you never refresh the results (data), Power BI continues to use the existing data. How, then, do you show when the results were last refreshed? This was the question I was trying to answer while designing a new Power BI report set about SQL Server in Enhansoft Reporting. Once I found a solution, I knew it would be helpful to others, so in this blog post I show you, step-by-step, how to add the last refreshed date and time to your Power BI reports.
After showing you how to create the table, I cover the steps for two different display options. In my research, I discovered that if you have a lot of space, using a simple card to add the last refreshed date and time is the best method. This style is shown in the Adding a Calculated Measure Field section. Following that section, I document the steps to my single-line option (a combined text box and card) solution.
How to Create the Table and Add the Last Refreshed Date and Time
The steps below about how to create the table are the same for both display options (the card and the text box/card combo). This method uses a query to populate the table.
By the way, in my last blog post, How to Display Version Number Info on Power BI Reports, instead of using a query, I manually entered the data in a table. If you don’t need to use a query, then check out that post!
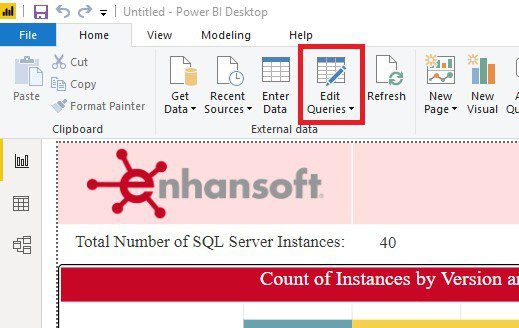
From the Home ribbon, click on Edit Queries. This takes you to Power BI’s Query Editor window.
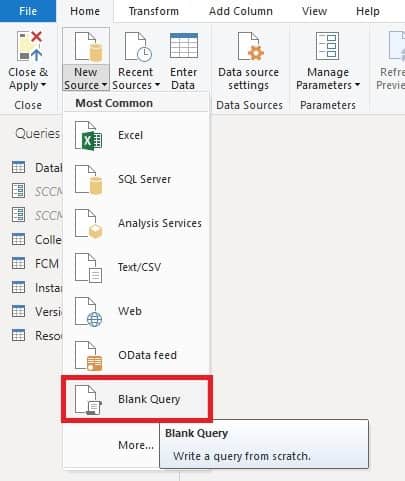
On the Query Editor window, from the Home ribbon, click on the New Source option. Next, select Blank Query.
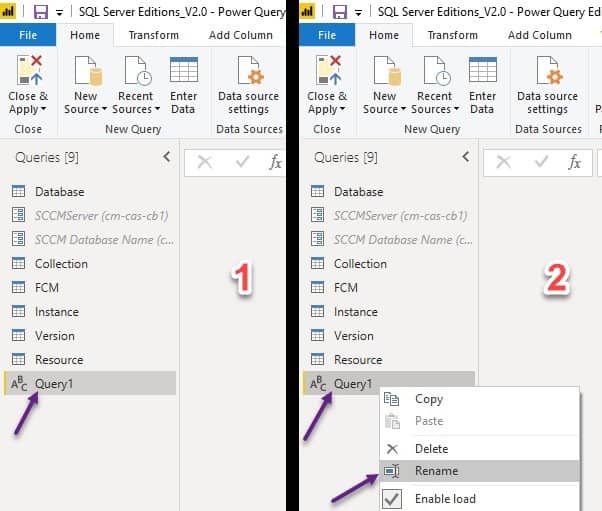
Under the Queries section, right-click on the newly created Query1 (1) and select Rename (2).
In this example, I renamed the query to Date Last Refreshed.
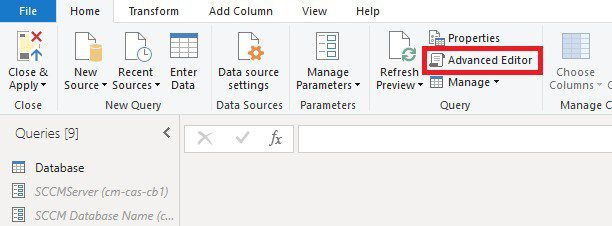
Now click on the Advanced Editor option, from the Home ribbon, and paste the M code (see below).
let
Source = #table(type table[Date Last Refreshed=datetime], {{DateTime.LocalNow()}})
in
Source
The M code creates a column with the name Date Last Refreshed and it gathers the current date and time.
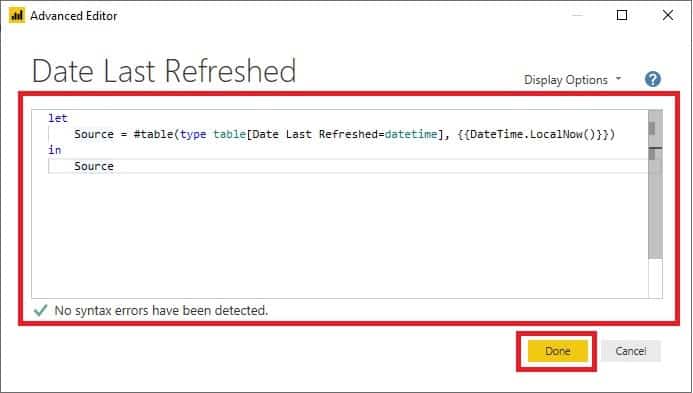
The Advanced Editor window for Date Last Refreshed should look similar to the one above after you enter the M code. Now, click on the Done button in the bottom right-hand corner of the window.
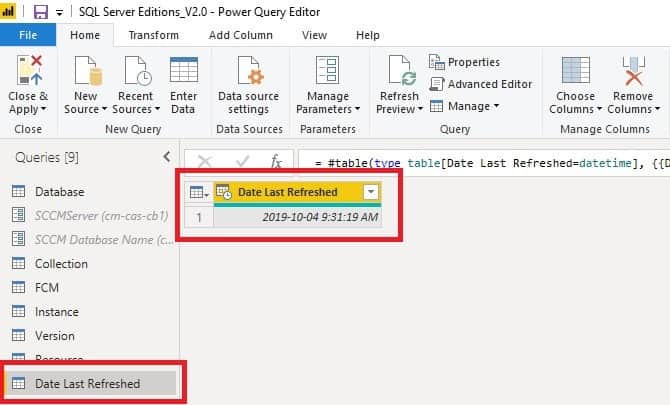
Once the table is created for Date Last Refreshed, a column also called, Date Last Refreshed appears.
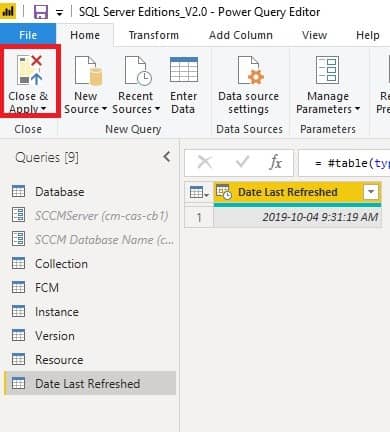
Adding a Calculated Measure Field
Following these steps is useful when you have a fair amount of space for your card. You will see what I mean in a bit. I like this method, but it just didn’t work for my needs. If you don’t have a lot of space, then you might want to skip ahead to the Single Line Option section of this post.
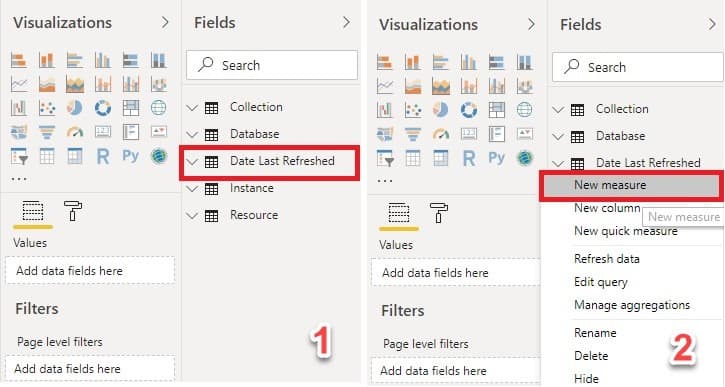
Once back on the report’s main window, the newly created table Date Last Refreshed appears under the Fields pane (1).
The next step is to add a calculated measure field to use with the Date Last Refreshed column.
In order to do that, right-click on Date Last Refreshed and choose the New measure option (2).

A calculation area opens up just below the Home ribbon. In this space enter the DAX query (see below) for the measure (string text with the Date Last Refreshed column data) to be entered.
Date Last Refreshed = VALUES (‘Date Last Refreshed'[Date Last Refreshed])
Now simply add the measure to a card and you are done!

Notice that by creating a measure with the name Date Last Refreshed, it acts like a title on the card. This means that you don’t need to add a text box to give this information a description. I like this method, BUT it means that the card is too long and too tall for my needs. This is not what I want.
Single Line Option – Text Box/Card Combo
What I want is a single line with the date and time. It allows me to leverage more space on the canvas for my report details.
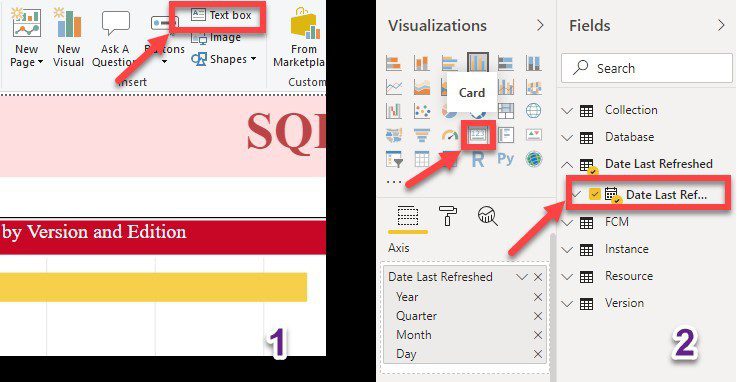
The text box acts as the title (description) of the card. The card, on the other hand, only displays the last refreshed date and time details.
I start by selecting Text box (1) from the Home ribbon and then entering the text, Date Last Refreshed. Next, I select a Card from the Visualizations pane and add the Date Last Refreshed column from the Fields pane section to this card (2).

Once you have both the text box and the card on the canvas, you can customize them as per your requirements. In my case, I adjusted the font size, font color, and I turned off the category label from the Format tab under the Visualizationspane (steps not shown).
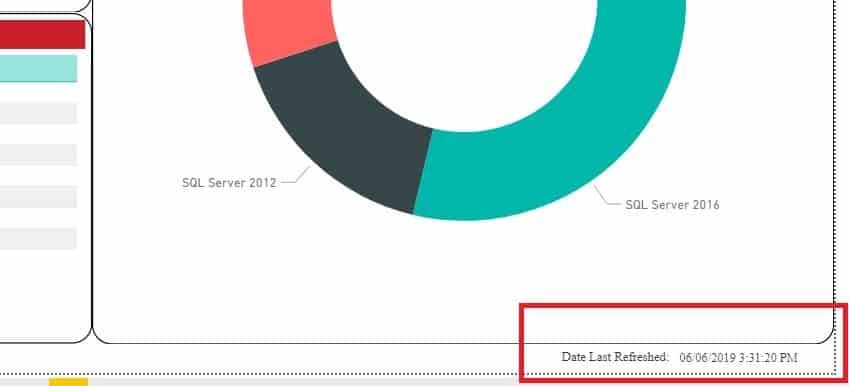
Finally, I re-sized both the text box and card in order to fit them in the bottom right-hand corner of the page. Using this method, instead of adding a calculated measure to a card, gave me more area for my chart.
Conclusion on How to Add the Last Refreshed Date and Time to a Power BI Report
As I mentioned earlier, while researching this topic, I found several possible ways to display this information in a Power BI report, but I needed to tweak them because I required a slightly different solution – a single-line option. Isn’t that always the case? Sometimes you can’t find exactly what you need. Anyways, I gathered a few tips from various Power BI sources including the Microsoft Power BI Community Forums and this Stack Overflow Forum. Check out the conversations by clicking on the links!
Power BI is an awesome application especially for report developers, but if reporting isn’t your thing and you have SCCM, you can check out some of Enhansoft’s Power BI reports. If you have any questions regarding this blog post or Power BI, you can reach me on Twitter @SuaresLeonard.
